A findings-led review · Molecular imaging · Ovarian hormones and the brain
The Estrogen Signal
Molecular imaging already sees the living brain change with ovarian state. This review takes that signal apart: what has been observed, how confidently it can be attributed to estrogen, and where a collaboration could find the next good question.
The answer, before the evidence
Many measurements touch estrogen's action in the brain. None yet captures it alone.
Estrogen-related brain imaging is not one measurement problem. It spans receptor availability, the enzymes that make and inactivate estrogen locally, neurotransmitter and synaptic systems, energy use, inflammatory pathways and the vascular physiology that delivers every tracer.
Each of these windows has produced something valuable: human observations across cycles, menopause, contraception and hormone treatment; deliberate endocrine perturbations; animal models of abrupt and gradual ovarian loss; and tracers still in development. Their signals, though, do not share a common scale of estrogen action. Several rest on the same groups of people, on reference regions that may themselves move, or on reading that has not yet gone beyond the abstract.
The most productive opportunity is therefore an interface rather than a single image: a well-defined endocrine contrast, connected to a validated molecular measurement and checked against an orthogonal biological assay. The eight chapters below decompose the signal into its candidate explanations, from receptor binding to the cohorts and data that carry the evidence, and the last chapter turns them into four concrete ways a collaboration could begin.
Null results, failed tracers and unfinished source chains stay in the picture throughout. Placed honestly, they show where the opportunity lies.
8
bands of explanation for one hormone-sensitive signal: the chapters
73
human imaging study rows mapped, across 11 endocrine contexts and 35 tracers or modalities (rows, not independent cohorts)
47 / 73
of those rows read at abstract level only, so detail is marked by depth throughout
4
collaboration entry points, framed without assuming anyone's facilities or data access
Five distinctions
Most disagreements in this field dissolve once you ask which line a claim crosses
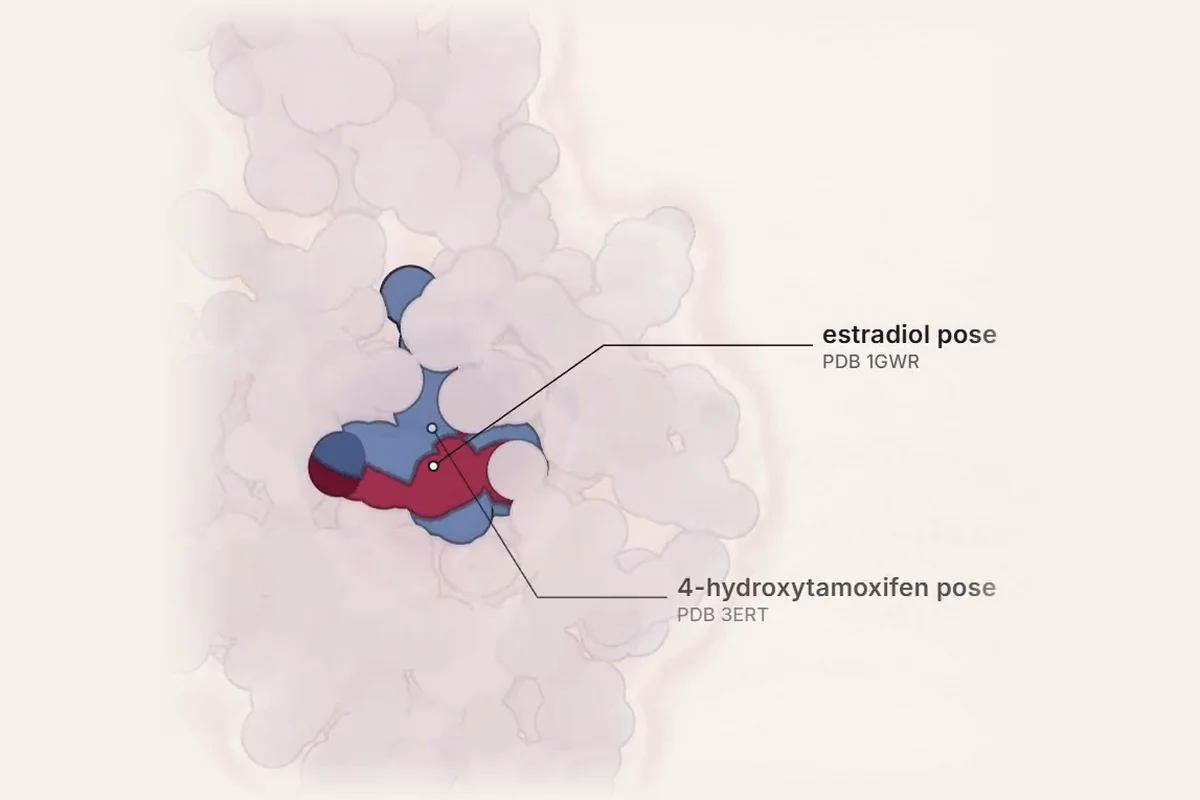
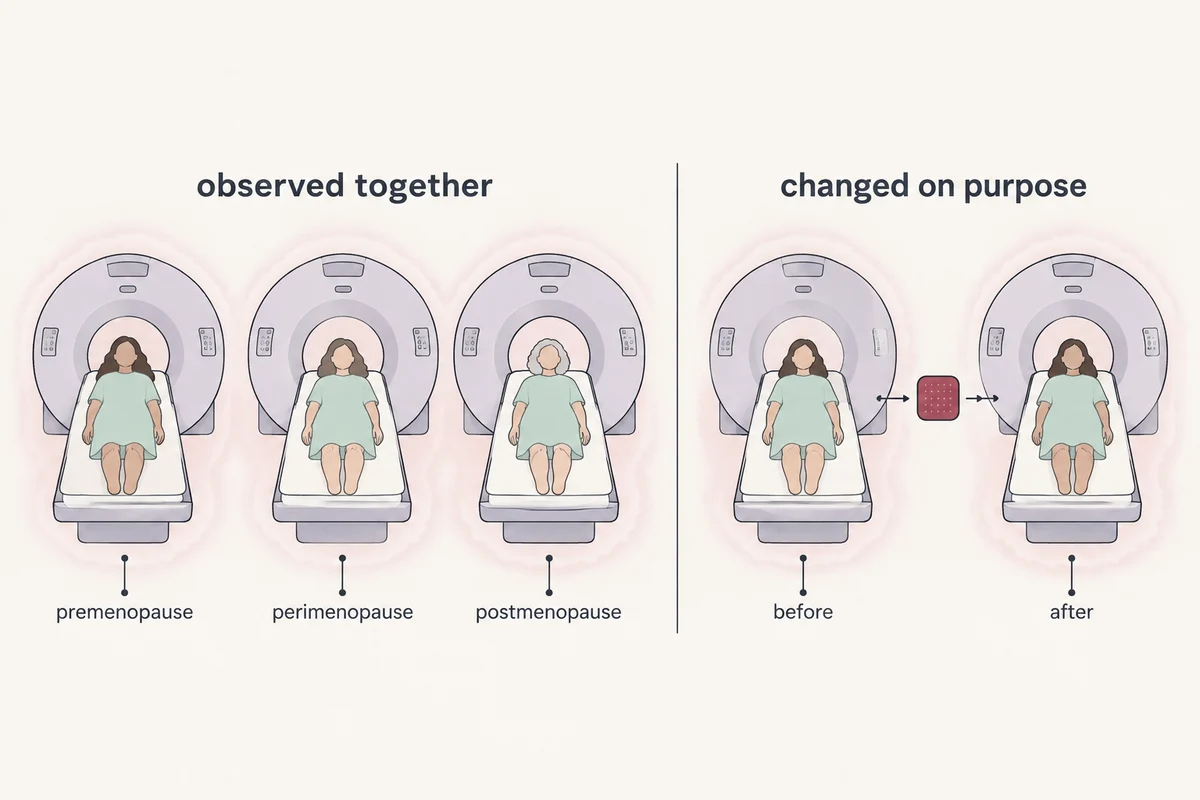
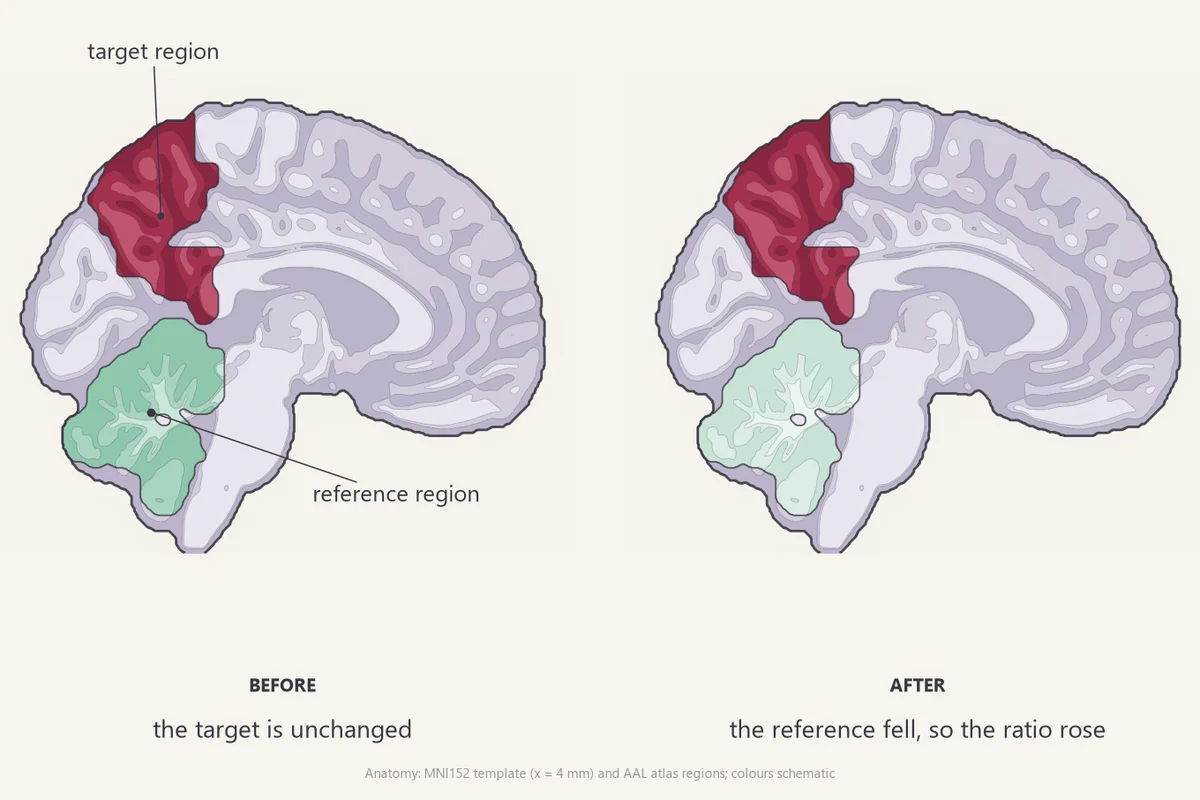
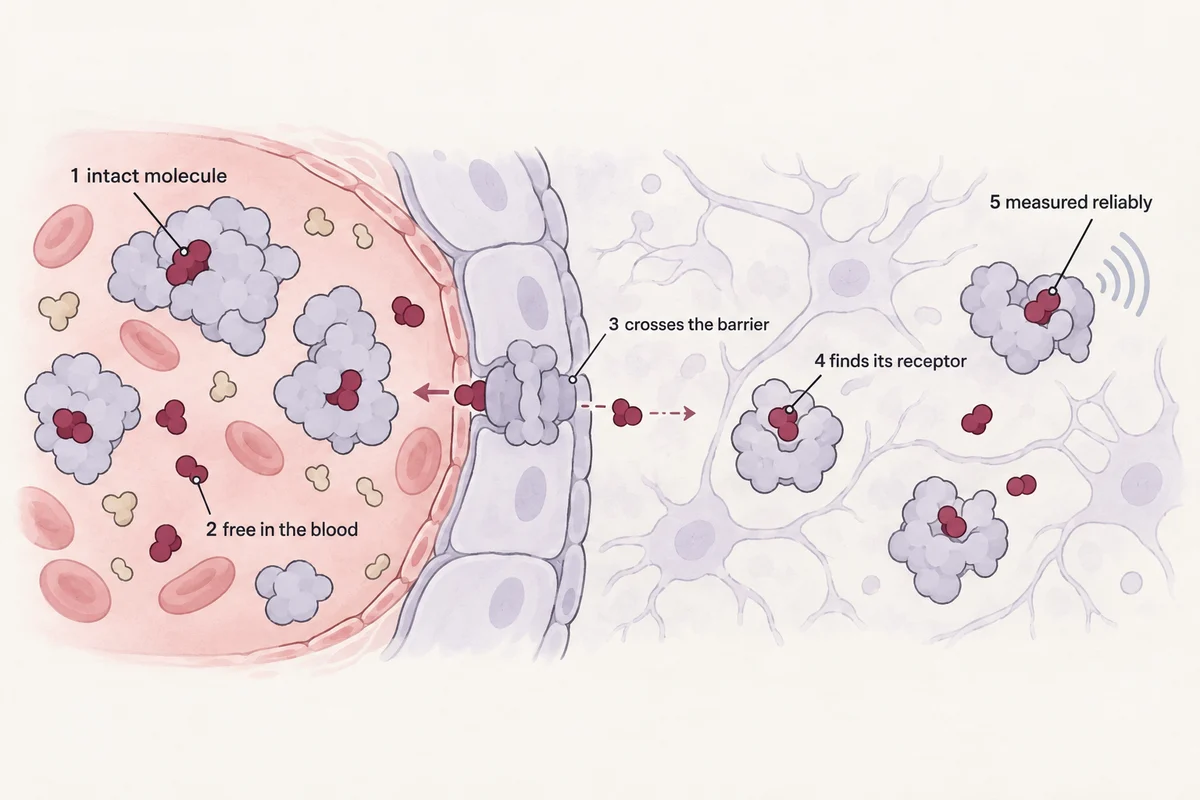
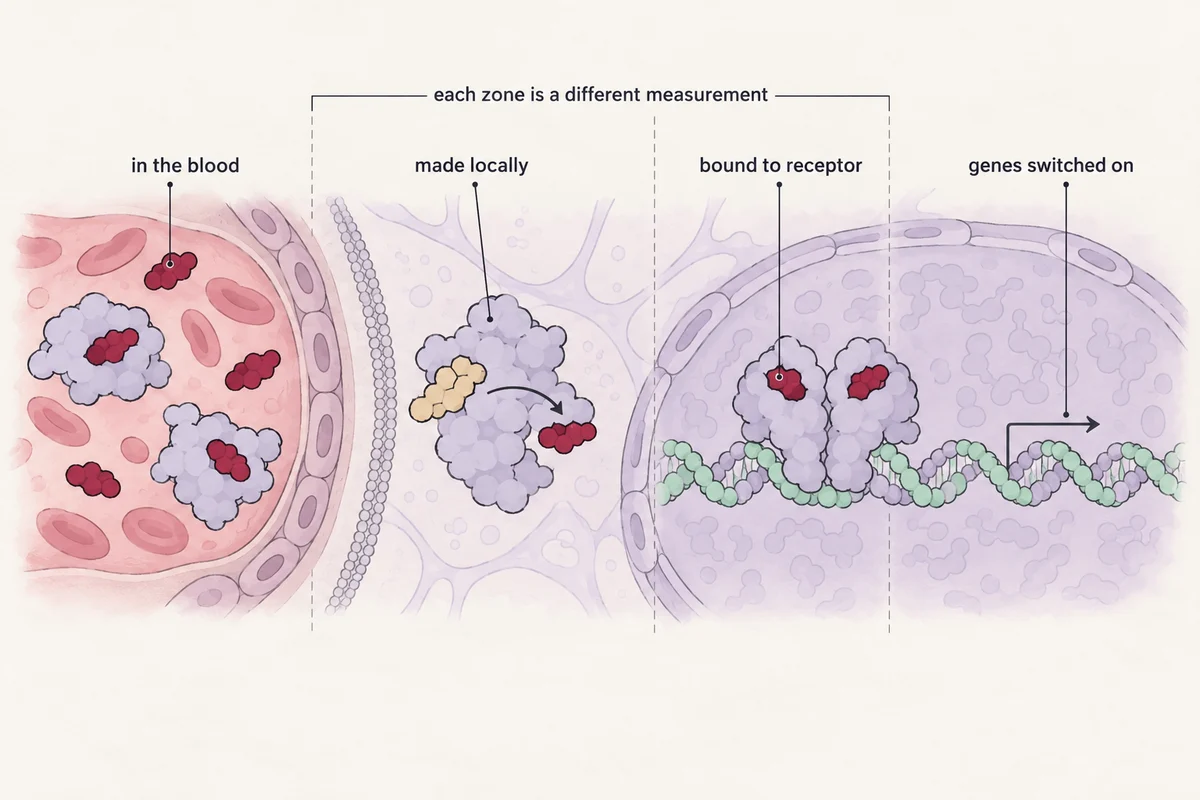
Card 2 is a real structure (PDB 1GWR and 3ERT, from the chapter 1 film). Card 4 is drawn from the MNI152 template with AAL atlas regions. Cards 1, 3 and 5 are AI-assisted schematic illustrations made in the same style from real references.
How to read the evidence
Every claim says what kind of claim it is, and how deeply its source was read
Evidence markers
Small markers after a load-bearing sentence separate what a source reports from what anyone makes of it:
- a result the source actually reports
- the source authors' interpretation
- this review's synthesis across sources
- a proposal or testable idea
- needs more source work before a stronger claim
Dots = reading depth of the source. full text and methods checked · partial (abstract plus indexed methods or sections) · registry, protocol or metadata only · a lead, not yet inspected.
Three kinds of underline
dotted a plain-language definition (first use in each section) · dashed an illustrated definition · solid a source card: design, population, endpoint, finding, limitation, reading depth, cohort overlap, and a link to the original.
Hover or focus with the keyboard; on a phone, tap. Tap again or press Esc to close.
Three reading speeds
Skim keeps headings, the one-sentence lede under each, every figure, film and verdict. Read is the full narrative. Deep also opens the technical deep dives. The switch sits top right and remembers your choice.
Pictures that are, and are not, evidence
Figures are code-built from the sources and carry a number, a source line and a caveat. Films are rendered from code. Molecular films use real deposited protein structures and say so on screen; everything else is marked schematic. Illustrations are AI-assisted explanations, labelled as such, and never carry data.
Every chapter has the same spine
Each chapter opens with four questions (observed, attribution, discriminator, next question) and closes with what it does not show, so you always know where the evidence stops.
The chapters
Eight bands of one signal
01Direct receptor imagingA valuable signal with an unresolved attributionFES retention changes across the menopause transition; that the changing part is cerebral receptor has not been shown.
02Synthesis and inactivationMaking and clearing estrogen are separate imaging targetsBoth enzymes can be imaged as binding sites; neither tracer measures how fast estradiol appears.
03Endocrine trajectoriesEndocrine trajectories matter as much as the choice of tracerAbrupt loss, gradual depletion, suppression and replacement change different hormones on different clocks.
04Downstream windowsMany windows on endocrine responseSeventy-three rows of human imaging, from serotonin to tau: mostly associations, each on its own clock.
05Neuroimmune imagingSeveral different measurements, not one inflammation dialMore cells, more protein per cell, or a different cell type can all raise the same signal.
06Vascular physiologyFlow is biology, and a condition of every measurementInflow, perfusion, delivery, permeability and transport are five quantities, not one.
07Chemistry and drug developmentEvery failure is at a different gateIdentity, affinity, exposure, specific signal and reliable quantification: no compound has cleared all five.
08Resources and collaborationWhat already exists, and four ways inDeposits, cohorts and registered designs in different states of readiness, turned into a menu.
What this review is, and is not
An exploratory evidence synthesis prepared in October 2026. It is not a completed systematic review, a treatment recommendation or an experiment-ready protocol. Reading depth varies by source and is marked on every load-bearing claim. No participant-level images, blood curves or expression values were reanalysed here. A failed search or download is never treated as evidence that a study does not exist, and repeated publications from one cohort are never counted as replication.
01
Direct receptor imaging · FES, 4FMFES, engineered reporters
A valuable signal with an unresolved attribution
A tracer built from estradiol reaches the human brain, and the picture it makes changes across the menopause transition. What has not been shown is that the changing part of that picture is cerebral estrogen receptor. This chapter separates the observation from the attribution, and asks which single measurement would close the gap.
ObservedCerebellum-referenced FES retention differs by menopause stage in one cohort of 54; a drug challenge reduces the pituitary signal in the 4 rescanned members of a separate 7-person cohort.
AttributionCerebral receptor density is one candidate. Blood input, labelled metabolites, non-specific uptake, partial-volume mixing and the reference region remain live alternatives.
DiscriminatorDisplacement in cerebral tissue with demonstrated free drug at the target, read against an arterial input and a reference tested for invariance.
Next questionHow much of the menopause contrast survives a change of denominator — answerable on scans that already exist.
What the scanner actually counts
A PET image is a map of positron annihilations per unit volume per unit time. Nothing in the physics distinguishes an annihilation from a receptor-bound tracer molecule from one dissolved in myelin, circulating in a capillary, or attached to a breakdown product of the tracer.
The tracer here is FES, 16α-[18F]fluoro-17β-estradiol: estradiol with fluorine-18 at the 16α position. Fluorine-18's 109.8-minute half-life is what makes a 90-minute dynamic scan practical. The molecule strongly prefers ERα — one binding study reported 94 nM for ERα with negligible ERβ binding . That selectivity is why the tracer is useful, and it is the first boundary on meaning: an FES image is ERα-weighted, blind by design to most of the ERβ and membrane-receptor biology the same tissue is doing.
What the camera records in a region is a time–activity curve: radioactivity concentration, frame by frame, for ninety minutes. That one curve is a sum of at least four physically distinct contributions, and the whole interpretive problem of this chapter lives in the fact that they reach the detector indistinguishable from one another.
First, specific binding: tracer in an estrogen receptor. Second, nondisplaceable uptake: tracer free in tissue water plus tracer partitioned into lipid. FES is lipophilic and this component is large in human brain — the white-matter signal that dominates a clinical FES head image is the textbook case, and it was not reduced by drug in the one human challenge that looked . Third, labelled metabolites: in seven women with arterial sampling, intact parent was 81 ± 7% of plasma radioactivity at five minutes and 14 ± 3% at ninety. By the end of a scan, most radioactivity passing the brain is no longer the tracer. Fourth, tracer still in blood, inside the vessels of the region rather than its tissue.
Whether labelled metabolites enter brain tissue is a separate question from whether they exist in plasma, and the answer is species-dependent. In rats, parent fell from 63 ± 3% of brain radioactivity at thirty minutes to 34% at two hours. In rhesus monkeys the distribution volume was stable from sixty minutes on, which the authors read as metabolites not accumulating centrally . Neither measurement exists for the human midlife cohorts that carry the menopause finding .
Every quantitative method applied to these data is a strategy for removing some contributions and tolerating the rest. A metabolite-corrected arterial input removes the blood term and yields a distribution volume. A reference region removes the nondisplaceable term — but only insofar as the reference holds no target and behaves identically in the groups compared. A late static window removes nothing and hopes the early contributions have washed out. The choice is not cosmetic: it decides which alternative explanations remain available afterwards.
The brightest thing in the picture is outside the brain
In every species examined, FES produces one dominant intracranial focus, and it sits in the pituitary — a gland whose blood supply is not protected by the blood–brain barrier. Everything convincingly demonstrated about specific FES binding has been demonstrated there.
In rats, pituitary uptake exceeded every other brain region by 4.4- to 18.9-fold, with hypothalamus a distant second; co-injected estradiol lowered pituitary and hypothalamic uptake and left the rest alone . In rhesus monkeys with arterial input and metabolite correction, estradiol pre-treatment cut pituitary VT/fP from 164 to 59 in one animal and 186 to 50 in the other, while twelve other regions moved a few per cent in no consistent direction. In seven women with full arterial kinetics, the only region a drug reduced was, again, the pituitary. Across mice, rats and 31 patients imaged with two estradiol-based tracers, the pituitary was the one reliably discernible brain focus in all three species.
That convergence is the strongest evidence in the field that FES binds estrogen receptors in living tissue. It is also the wrong kind of evidence for the question this report is about. The anterior pituitary is supplied by fenestrated capillaries; molecules reach it without crossing the barrier that protects cerebral tissue. A tracer that labels the pituitary has shown it binds the receptor. It has not shown it can do so on the other side of that barrier, at the receptor densities cerebral tissue actually has .

The counter-argument is well supported and deserves equal weight: delivery is probably not the limiting problem. In rats the influx constant K1 sat in the ordinary range for brain tracers, which is not what an efflux-limited molecule looks like . In humans, peak whole-brain uptake reached SUV 3.47 ± 0.37 against a pituitary peak of 4.82 ± 0.61; by eighty minutes whole brain had fallen to 0.40 ± 0.04 while the pituitary held 1.17 ± 0.24. The tracer enters the brain freely. It simply does not stay anywhere in particular. The likelier diagnosis is a ratio problem — cerebral receptor concentrations low relative to the tracer's affinity and to how much molecule is lipophilically parked around them — and that calls for a probe with less nonspecific uptake, not a more permeable one .
A week of a degrader is not an occupancy test
The only human pharmacological challenge to brain FES found for this review used a selective estrogen receptor degrader given daily for seven days. That design answers a question about drug action; it does not cleanly answer how many receptors the tracer was bound to.
Ghazanfari 2024 reanalysed brain scans acquired inside a phase-1 trial of elacestrant . Seven healthy postmenopausal women had a 90-minute dynamic scan with arterial sampling and metabolite-corrected input; four were rescanned four hours after the last of seven daily 500 mg doses. Pituitary VT fell from 2.98 ± 1.30 to 1.65 ± 0.59, and the authors' Lassen plot put the reduction in availability at 62 to 64% . No cerebral region showed a significant reduction. Three features of the design govern how that cerebral null should be read, and none is a criticism of a careful study that remains the best human kinetic dataset for this tracer.
The drug degrades its target. A SERD both competes for the pocket and drives the receptor to be destroyed. After seven days, a reduced signal could mean the pocket was occupied or that there were fewer pockets. The image cannot separate them. Target engagement is the honest label; occupancy is not .

Cerebral exposure was never demonstrated at the target. In the parent trial, the median ratio of elacestrant in cerebrospinal fluid to plasma was 0.126% at 500 mg and 0.205% at 200 mg . Cerebrospinal fluid is a poor proxy for unbound drug at a receptor inside tissue. A blocking study whose blocker may not have reached an effective free concentration cannot distinguish "no receptor here" from "no drug here" .
Several cerebral estimates moved the wrong way. Temporal lobe VT rose from 0.70 ± 0.29 to 1.18 ± 0.27, cingulate from 0.85 ± 0.31 to 1.28 ± 0.36 and frontal lobe from 0.83 ± 0.29 to 1.39 ± 0.57, all flagged significant in the published table . A competitive block does not raise distribution volumes. Whatever produced those increases, they are a reminder that these estimates are fragile, and that reading the non-significant regions as a clean negative credits the data more than the positive-direction regions allow .
CaveatA small negative challenge in four people does not establish that cerebral estrogen receptors are unmeasurable, any more than the pituitary result establishes that they are measurable. Nulls are not equivalence.
Deep dive: what the 62 to 64% figure is, and what it is not
The number comes from a Lassen plot: the drug-induced change in distribution volume is regressed across regions against the baseline value, the slope read as one occupancy applying to all of them and the intercept as a shared nondisplaceable volume. It is a standard method resting on two assumptions — that the nondisplaceable volume really is common across the regions entered, and that the only thing the drug changed is specific binding .
Both are strained here. The pituitary sits outside the barrier with its own delivery, yet was modelled with the whole-brain K1/k2 ratio ; and before that ratio was fixed, 89.5% of post-dose BPND estimates carried a standard error above 25%. Hold the 62 to 64% as a model-derived estimate in four people, not a measured fraction.
One bookkeeping discrepancy is worth stating plainly. The parent trial describes its imaging cohort as thirteen participants, seven at 200 mg and six at 500 mg; the brain reanalysis describes all seven of its participants as having received 500 mg. Both are in print and the mapping between them is unpublished .
The menopause observation, and the region it is divided by
The finding that motivates the field is real and well executed: in 54 carefully screened midlife women, cerebellum-referenced FES retention rose stepwise from pre- to peri- to postmenopause. The open question is what the denominator of that ratio was doing.
Mosconi 2024 scanned 54 women aged 40 to 65, eighteen per menopause stage, with a brain-dedicated 90-minute dynamic protocol and co-registered MRI, and no arterial sampling . Distribution volume ratios came from Logan analysis against a custom cerebellar region, adjusted for age, plasma estradiol and SHBG — which differed sharply across groups, from 159 ± 29 pg/mL estradiol premenopause to 18 ± 26 postmenopause. The differences survived adjustment: pituitary DVR was 36% higher postmenopause, posterior cingulate and caudate also reached significance, and the regional pattern classified every participant's stage correctly.
54
participants, 18 per menopause stage (index cohort)
90 min
dynamic acquisition, 30 frames, no arterial sampling
+36%
pituitary DVR, postmenopause versus premenopause
1 – 9%
range of post- versus premenopausal DVR differences across the eight cerebral regions reported (pituitary excluded)
Now the denominator. The reference was not simply "the cerebellum": it was built — restricted first to the outermost part of cerebellar crus II on the argument that this tissue expresses little ERα, then refined by supervised clustering to the sub-portion whose uptake was invariant across the menopause classes .
That second step is where the difficulty becomes concrete. The classifier that chose the reference voxels was trained on these images to discriminate the same three groups whose differences are the study's result. Choosing a denominator for its flatness across the contrast you are about to test makes the denominator a function of the result rather than an independent measure of background . The supplement states the procedure openly, so this is a transparency point and not a hidden flaw — but the reference's invariance was selected for, not tested.
Two details compound it. The parametric images retained only voxels with binding potential above zero — defensible for making readable maps, and it also means the voxelwise analysis could only see tissue brighter than the denominator . And one reported region, the hypothalamus, has a DVR below 1 in the pre- and perimenopausal groups (0.955 and 0.984) and only 1.027 postmenopause: no more retention than the reference, in a structure rodent work places near the top of the ERα rank order.
None of this makes the menopause contrast an artifact. The authors' defence is strong on its own terms: nonspecific binding, being independent of receptor expression, should not generate a stepwise gradient across three groups . That argument rests on one assumption — that nonspecific uptake really is invariant across endocrine states. Tissue lipid composition, white-matter structure and plasma protein binding all change across midlife, and FES is a lipophilic molecule carried by SHBG, whose concentration halved across these same groups. The assumption is plausible. It has not been measured .
Publication is not replication
Three human FES papers sit at the centre of this literature. They represent two groups of participants, not three, and the two that share participants also share a denominator.
Nerattini 2025 asked whether a short static acquisition could stand in for the full dynamic analysis. Comparing five twenty-minute SUVR windows against the Logan DVR, the 30–50 minute window agreed best — pituitary intraclass correlation 0.973 — and the paper recommends a 30–60 minute static protocol for clinical use. It is clear about its own scope, limiting the validated interpretation to relative pituitary retention and calling the other regions preliminary.
Its 55 participants are the 54 of the earlier study plus one postmenopausal woman whose laboratory data arrived later . SUVR and DVR are computed from the same scans, over overlapping windows, normalised to the same cerebellar region. Their agreement is close to a mathematical identity: two summaries of one curve, divided by the same number, will track each other. The study calibrates a simplification; it cannot independently confirm what the signal is, because nothing in its design is independent of the study it calibrates against . The same structure appears on the pharmacological side: the seven-participant challenge is a reanalysis of the phase-1 imaging cohort, so counting the two reports as two pieces of evidence double-counts seven people.
The disagreement in print
This is one of the few places in the report where specialists have publicly contradicted each other about what an image means. The exchange repays close reading, because each side is right about something different.
Biegon 2024, a letter co-signed by three senior imaging scientists, argued that the reported regional pattern does not match the known distribution of brain estrogen receptors but does match white matter: hypothalamus, which should rank near the top, came out lowest, while thalamus and caudate — low in receptor, high in adjacent white matter — came out near the top. The letter also held that labels in the published figure point at white-matter structures . Mosconi 2025 replied that those leader lines indicate general anatomy rather than sampled boundaries, that regions were placed on gray matter in a standard atlas, and that the figure displays SUV while the analysis used DVR. On the prior literature the reply is largely correct: the rodent studies cited report low but non-zero uptake outside the pituitary, not absence, and one states explicitly that FES uptake is not limited by the blood–brain barrier.
The critique's strongest point
The published rank order of regional values does not follow the receptor map. It does follow tissue type. A region-of-interest analysis at this resolution mixes gray and white matter, and the mixing fraction differs by region.
The reply's strongest point
Signal independent of receptor expression cannot, on its own, produce a stepwise difference across three menopause groups. Something is varying with endocrine state.
Both can hold at once, and our reading is that they do. The rank order is a genuine problem for the claim that these values are proportional to regional receptor density. The group gradient is a genuine problem for the claim that the signal is inert background. The reconciling possibility — that something varies with endocrine state which is not cerebral receptor number — is the one neither letter tests . Candidates are easy to list and none was measured in these participants: partial-volume mixing changing with atrophy, white-matter composition, plasma protein binding, metabolite production, or the reference region itself. What the exchange demonstrably did not add was new evidence: no blocking experiment, no arterial input, no test–retest, no partial-volume correction, no independent reference validation .
A second tracer, and what it did and did not settle
4FMFES was designed to fix the specific weakness that limits FES in brain — too much nonspecific signal. It demonstrably improves contrast. Improving contrast and demonstrating cerebral specific binding are different achievements.
Paquette 2020 pooled preclinical and clinical datasets to compare the two tracers head to head . In 31 breast cancer patients scanned with both, pituitary SUVmax was actually lower with 4FMFES (0.73 ± 0.21) than with FES (1.15 ± 0.22), but cortical background was about half, so pituitary-to-cortex contrast was better: 2.61 ± 0.73 against 2.00 ± 0.47. The authors attribute the lower background to roughly 2.5-fold greater resistance to metabolism and almost no plasma-globulin binding. In rats, co-injected estradiol reduced pituitary 4FMFES uptake from 0.45 ± 0.13 to 0.02 ± 0.01 %ID/g — a near-complete block, and the cleanest displacement result in this chapter — while ovariectomy raised rat pituitary FES uptake about 1.7-fold.
Two boundaries on that package. There was no human blocking experiment: the patient scans establish where the tracer goes, not what holds it. And in those 31 patients, pituitary uptake did not differ significantly between the 9 premenopausal and 22 postmenopausal women with either tracer .
That is not a contradiction of the menopause finding: the designs differ in almost every way that matters — an oncology cohort scanned whole-body with the head off-centre, uneven groups, no standardisation to cycle phase, uptake-guided regions, and a frontal-cortex reference. Any of those could hide an effect this size. But it is the only other human dataset we found that examines pituitary uptake by menopause status, and a reader deserves to know it did not see the same thing .
The same paper makes a resolution argument that bears on every cerebral FES result. Clinical PET resolves about 4.8 mm, roughly 111 µL; the human pituitary is 460 to 520 µL, only four to five times that. The small-animal scanner used here reached 0.74 mm, about 0.4 µL, and with it the authors separated a second focus anterior to the pituitary in rodents plus three further foci in dissected brain — structures that do not exist as separable objects in a human scan . The regions where estrogen receptors are densest are, in humans, at or below the size a clinical scanner can hold apart from their neighbours.
What to carry forwardResolution is not a property of the pictures; it is part of the measurement model. A bright small structure beside a dim one produces spill-in, and spill-in is not reduced by scanning more people.
The clinical-development thread is thin but real. A registered study, MOSAIC at the Université de Sherbrooke — the group that developed 4FMFES — proposes to combine the tracer with carbon-11 acetoacetate and FDG in 45 participants across the menopausal transition. Checked directly on 2 October 2026, the record still reads "not yet recruiting", was last updated in June 2025, and gives an estimated start of July 2025 that has passed . That is a registry record, not recruitment and not results. An earlier attempt to validate brain FES quantification against arterial input was terminated with three participants enrolled and nothing posted — a recruitment outcome, not a technical one.
Engineered receptors are a bridge to a different question
Two studies show FES imaging an estrogen receptor in the brain with excellent contrast. In both, the receptor was put there on purpose.
ChRERα fuses a light-activated ion channel to the ligand-binding domain of ERα, delivered by viral vector. The pocket is preserved, so FES binds it; the channel component carries it to the cell membrane, at densities and in places no native tissue provides. Bonaventura 2023 tracked it in rats and two squirrel monkeys for up to 80 weeks, injection-site binding potential rising from 0.12 to 0.47 and a connected parietal site from 0.1 to 1.1, with the resulting anatomical map overlapping a functional connectivity map from a separate cohort . Li 2024 took the system to three rhesus monkeys, where injection-site uptake rose 70% and 86% in the two animals that expressed the construct and — the more interesting result — correctly identified the third, in which transduction had failed, before any behavioural experiment was wasted on it .

This belongs in the chapter rather than a methods appendix because of what the same papers say when they are not imaging the reporter. Li 2024's native baseline phase is the best-controlled estrogen-receptor blocking study in a primate brain that we found: full kinetic modelling, metabolite-corrected arterial input, estradiol pre-treatment. Pituitary VT/fP dropped by about two-thirds; the cerebellum and eleven other regions did not move. The authors concluded that endogenous expression in monkey brain is negligible enough for the cerebellum to serve as a reference . Read from the other direction, that is a negative result about native cerebral FES binding in a primate, obtained with better methods than any human study has used.
Three qualifications keep it from being decisive. The blocking dose was deliberately conservative — 0.1 mg/kg estradiol, a third of the rodent dose, chosen for safety. The sample is two animals. And "no detectable specific binding at this sensitivity" is not "no receptors": the same paper notes that the comparison reporter produced better signal-to-background despite binding its target about fifteen times more weakly, so affinity was not the limiting quantity . The rhesus data were deposited publicly and inventoried in September 2026 as eight files, about 2.5 GB, under a CC BY 4.0 licence; the archive was not downloaded, so its contents are unverified .
HypothesisIf a reporter construct is detectable against the cerebral background and a native receptor is not, the gap is a sensitivity threshold with a number attached. Estimating that threshold — what receptor concentration FES would need to produce a detectable specific signal against measured human nondisplaceable uptake — is a desk calculation, and it would tell you whether the native question is hard or impossible.
| Study | Design and species | n, and its role | What it can establish | What it cannot | Read |
|---|---|---|---|---|---|
| Mosconi 2024 | Cross-sectional dynamic FES PET/MRI across menopause stages; Logan DVR against a built cerebellar reference; human | 54; index cohort, 18 per stage | That a cerebellum-referenced phenotype differs by menopause stage, independent of age, estradiol and SHBG | That the differing quantity is receptor density. No block, no arterial input, no test–retest, no partial-volume correction | Full text, both supplements |
| Nerattini 2025 | Static SUVR windows against dynamic DVR on the same scans; human | 55; 54 of them are the cohort above | That a 30–60 min static window reproduces the dynamic outcome closely enough for use, chiefly in pituitary | Independent validation: the two measures share scans, windows and denominator | Full text |
| Ghazanfari 2024 | Dynamic FES PET with arterial input, before and after seven days of an oral SERD; human | 7 baseline, 4 rescanned; reanalysis of a phase-1 cohort | A pharmacologically reducible pituitary component, and which kinetic model the data support | An occupancy fraction, or cerebral specificity in either direction. Cerebral free drug was never measured | Full text, supplement |
| Conlan 2020 | Phase-1 pharmacokinetics with an FES PET and lumbar-puncture sub-cohort; human | 140 dosed; 13 imaged | Uterine occupancy, pituitary engagement, drug detectable in cerebrospinal fluid | Brain target-site exposure. Pituitary values had no usable background region; the dynamic brain scan was dropped mid-study | Full text, correction |
| Paquette 2020 | Paired FES and 4FMFES, retrospective brain analysis; mouse, rat and human | 31 patients (9 pre, 22 post); 8 mice; rat groups of 3 | Better 4FMFES pituitary contrast in all three species; near-complete estradiol block of rat pituitary uptake | Human cerebral specificity. No human block; brain off-centre; resolution below pituitary size | Full text |
| Khayum 2014 | Small-animal FES PET across the oestrous cycle, after ovariectomy, and with co-injected estradiol; rat | Groups of 4–5; separate kinetic series | Displaceable pituitary and hypothalamic binding, hormone sensitivity, and that influx is not barrier-limited | Transfer to humans: rats lack SHBG and metabolise the tracer far faster. Pituitary spill-in is unexcluded | Full text |
| Li 2024 · native phase | Kinetic FES PET with arterial input, before and after estradiol; rhesus monkey | 2 animals with baseline and blocked pairs | Pituitary-only displaceable binding under the best methods applied in any primate | Absence of cerebral receptors. A third of the rodent blocking dose; two animals set a sensitivity floor | Full text, tables |
| Li 2024 · reporter phase | FES imaging of a virally delivered ERα-based construct, against a second reporter as control; rhesus monkey | 3 animals, 2 expressing | That FES reports expression of an engineered target, including a failed transduction | Anything about native receptors. No arterial sampling or displacement test in this phase | Full text, tables |
| Bonaventura 2023 | Longitudinal FES imaging of the same construct, with post-mortem confirmation; rat and squirrel monkey | 2 monkeys, up to 80 weeks | That engineered expression can be tracked for over a year, at the injection site and connected distal sites | Native receptor mapping. Histology in one of two monkeys; the reporter site was never blocked | Full text |
Which observation would do the most work
The useful question is not whether to believe brain FES images. It is which single piece of evidence, obtainable at reasonable cost, would most sharply separate specific cerebral binding from the alternatives that currently explain the same data.
Four explanations are on the table for the menopause contrast, and they are not equally hard to test. Roughly in order of what it would take to exclude each one:
The denominator moved. Cheapest to probe and the most consequential, because it needs no new participant. The published group means can be turned around arithmetically: for each region, how much would the reference have to change, with the target held exactly constant, to produce the difference that was reported ?
A worked example — explicitly hypotheticalTake the published posterior cingulate means: 1.375 premenopause and 1.498 postmenopause, a difference of 8.9%. If the target region's true signal had not changed at all, a reference 8.2% lower in the postmenopausal group would reproduce that entire difference. For caudate the required change is 6.7%; for hippocampus 1.0%; for the pituitary 26.3%. This is arithmetic on published adjusted group means — not a claim that the reference did change, and not a reanalysis of anyone's data. It puts a number on how much reference drift each finding could tolerate, and shows why the pituitary result is far more robust to this alternative than the cortical ones.
Partial-volume mixing changed. Gray matter thins across midlife, so a fixed region samples a different gray-to-white mixture in an older brain, and white-matter FES uptake is high and non-specific. Testable on the existing images: reconstruct with resolution modelling, or correct using the MRI segmentations already acquired, and report the sensitivity .
The input changed. Plasma protein binding, metabolism and free fraction plausibly differ across endocrine states, and SHBG — which protects FES from rapid metabolism — halved across these groups. A reference-tissue method is blind to this by construction. Testing it needs blood, not more scanning: parent fraction and free fraction in a subset would bound the effect .
Cerebral receptor availability changed. The explanation the field would most like to be true, and the only one needing a displacement experiment. The design constraints are now clear: a competitor whose free concentration at the target is demonstrated rather than assumed, given acutely so competition is not confounded with degradation, in enough participants to detect a small effect against a large nondisplaceable background, read against an arterial input rather than a reference chosen for flatness .
The order is deliberate. The first three can be attempted on data that already exist; only the fourth needs a new scan, and it is also the one most likely to fail for reasons unrelated to biology. The figure below holds the first explanation in your hands — three quantities in arbitrary units, no fitted values, no study's data — because that algebra is what this chapter has been circling.
Move any of the three. Watch which ones the ratio cannot tell apart.
Schematic · arbitrary units · no fitted values
1.67ratio
A last point about sequencing, which is really about cost. Everything solid in this chapter was obtained in the pituitary, and the pituitary is not a consolation prize: it is hormone-responsive, receptor-dense, it carries the strongest menopause signal, and it is the one place a human FES measurement has a demonstrated molecular meaning. A study built around it as a positive control, with cerebral regions as the exploratory arm, is more defensible than one that treats a cortical DVR as a receptor density from the start . The field's own diagnosis points the same way: a perspective from this literature argued for brain-first estrogen-receptor imaging and for a subtype-selective, brain-penetrant ligand that has not yet been demonstrated — a chemical limit rather than a conceptual one. The next chapter steps one layer upstream, to the enzyme that makes the hormone.
What this chapter does not show
- That FES is a validated assay of absolute cerebral estrogen-receptor density. No human study read for this review has demonstrated displaceable binding outside the pituitary.
- That the menopause-associated contrast is an artifact. Four explanations remain open and the published data do not choose between them.
- That pituitary validation is cerebral validation. The anterior pituitary is reached without crossing the blood–brain barrier.
- That the negative cerebral challenge disproves cerebral receptor biology: four rescanned participants, a degrader rather than an acute competitor, and no demonstration of free drug at the target.
- That 4FMFES measures cerebral specific binding. Better contrast was shown; a human blocking experiment was not performed.
- That an engineered reporter signal says anything about native receptor density, in either direction.
- That no further evidence exists. Registry records, a terminated study and an active imaging programme were visible but not readable at this depth.
02
Synthesis and inactivation
Making and clearing estrogen are separate imaging targets
Estrogen is built where it acts, by an enzyme that sits in the membrane of brain cells, and it is switched off again by a second family of enzymes. Both can be imaged, in the narrow sense that a labelled molecule binds them. Neither tracer measures the quantity the biology is about: how fast estradiol is appearing in a piece of tissue, and how fast it is being taken away.
ObservedIn ten healthy women, aromatase binding measured with [11C]cetrozole was highest in the thalamus and fell there after a single dose of nicotine. In endometriotic tissue, the same tracer's binding could not be blocked.
AttributionBoth results concern how much enzyme a ligand can reach. Neither measures estradiol production, and the human result rests on one group of participants, one reference region and one acquisition.
DiscriminatorThe same people measured twice: tracer binding alongside an independent handle on synthesis — reference-region behaviour under the challenge, substrate supply, or a product measure.
Next questionWhich quantity does an endocrine contrast actually move: the amount of enzyme, how much of it a ligand can occupy, or how fast it is working?
Upstream of the receptor is a different measurement problem
Chapter 1 asked what a receptor tracer is bound to. This chapter asks something a receptor tracer cannot answer: where the hormone is made, where it is destroyed, and how fast.
Aromatase is the enzyme that makes estrogens. It converts C19 androgens into C18 estrogens by aromatising the A ring of the steroid: androstenedione becomes estrone, testosterone becomes 17β-estradiol. It is a cytochrome P450 anchored in the membrane of the endoplasmic reticulum, and it carries out the final step of estrogen synthesis — which is why it is also the target of the aromatase inhibitors used in oncology, and why a labelled inhibitor was available to turn into a tracer in the first place.
In the human brain, the enzyme is concentrated in limbic structures. Imaging and post-mortem work place the highest levels in the thalamus, with clear signal in the amygdala, the hypothalamic and preoptic region and the medulla, and low but detectable amounts in white matter, putamen and cerebellum . That regional pattern is species-specific in a way that matters for reading the literature: in rodents the highest expression is in the medial amygdala and the bed nucleus of the stria terminalis, in non-human primates the amygdala leads, and in humans the thalamus does . A rodent finding and a human finding about "the aromatase-rich region" are not findings about the same place.
That promise is the reason to be careful. What a tracer reports is the number of binding sites it can reach under the conditions of the scan. An enzyme has at least three quantities attached to it, and they come apart: how much enzyme is present, how much of it a ligand can occupy, and how fast it is turning substrate into product. The first two are stocks, the third is a rate. A catalyst's abundance sets a ceiling on the rate; it does not set the rate. Throughput also depends on how much substrate arrives, on the supply of reducing equivalents the P450 reaction needs, on whatever else is competing for the active site, and on what happens to the product once it is made.
Immenschuh 2024, the thesis that collects most of the human cetrozole work, states the separation in its own methods discussion: availability measured by a radiotracer, catalytic activity measured by the rate at which labelled water is released as an androgen is converted, protein measured by immunohistochemistry, and messenger RNA measured by hybridisation each answer a different question, at a different spatial resolution . None of them substitutes for another. Imaging adds a fifth property that the bench assays do not have and cannot avoid: it is done through the blood, in a living person, in about an hour.
What to carry forwardA ligand that binds an enzyme reports how much enzyme it can reach. Production is a different measurement, and nothing in this chapter performs it in a living human brain.
What the human cetrozole work established, exactly
One tracer, one research programme and one group of ten women carry the human evidence. What that work established is a defensible way to quantify binding, not a reading of synthesis.
The tracer is [11C]cetrozole, a non-steroidal aromatase inhibitor labelled with carbon-11. It is described as binding a single site on the enzyme with higher affinity, better signal-to-noise and better metabolic stability than the earlier [11C]vorozole — a characterisation this review takes from the studies that cite Takahashi 2014 rather than from the original, so the assay conditions behind it were not checked. Carbon-11 decays with a half-life of 20.4 minutes, which fixes much of the design: the tracer has to be made next to the scanner, and the whole measurement has to be finished inside about ninety minutes.
Jonasson 2020 is the quantification study. Thirteen women were recruited and three were excluded for incomplete data or dropout, leaving ten analysed participants who contributed thirty scans across a baseline and two challenge sessions, eight of them with arterial sampling . A two-tissue compartment model fitted the data well, but the individual rate constants that would describe binding directly were unstable, which is a common and honest outcome and the reason the field reaches for reference-tissue models. The authors compared those simpler models against the compartmental result, concluded that a sixty-minute acquisition read with a simplified reference-tissue model was adequate, and showed that a static uptake ratio overestimated binding relative to it .
Two things follow that the study itself is careful about and a retelling tends to lose. First, the reference models were judged against an outcome that was itself normalised to the cerebellum . Agreement between two readings that share a denominator is internal consistency; it cannot show that the denominator is free of specific binding, and it cannot show that the denominator stays put when something changes. Second, agreement between a truncated and a full acquisition is not a test–retest experiment. No test–retest figure for this tracer — the same people scanned twice with nothing changed — appears in the sources behind this chapter, and that figure is the yardstick any later endocrine comparison would have to be measured against .
CaveatThe cerebellum is doing two jobs at once in this literature: it is the comparison tissue that defines the outcome, and it is a tissue in which low but detectable aromatase has been reported. A region cannot validate itself.
One recruitment, several kinds of outputParticipants, not publications
13
women recruitedthree excluded: incomplete PET data and dropout
10
analysed · 30 scans · arterial sampling in 8a baseline session and two challenge sessions, one menstrual cycle apart
Methods study
Model comparison; a 60-minute reference-tissue acquisition proposed; static ratios shown to overestimate.
Jonasson 2020
Nicotine challenge
The same scans, re-used for a pharmacological question. Thalamus 9 after one outlier; sensitivity analyses 8; cotinine correlation 7.
Dubol 2023
Thesis chapter
The same study again, in a wider context — and with the order of the two sessions described differently.
Immenschuh 2024
1the arterial comparison that speaks to the reference region exists for a single participant, in a supplement this review could not obtain
different samples inside the same research programme
21 womenmultimodal PET and MRI; unpublished at the thesis date
107 womenbehavioural study, no imaging
rat brainsgene expression and methylation
10 womena later testosterone challenge with the same tracer. Whether these are the same people is not established in the material behind this review, and a shared programme is not evidence of a shared sample. Dubol 2026
A challenge that moves the signal, and what it can carry
Nicotine lowered thalamic binding in eight of nine women. That is a real perturbation result, and it is routinely asked to carry more than its design can bear.
Dubol 2023 gave ten healthy non-smoking women, aged 22 to 33 with regular cycles, two ninety-minute dynamic scans one menstrual cycle apart, with 1 mg of nicotine nasal spray given five minutes before the second . The estimated dose reaching the circulation was about 0.007 mg/kg — chosen to resemble a cigarette, and for ethical reasons not exceeded. Three different scanners were used with reconstruction settings matched to a resolution of roughly 6 mm, and binding was read as a cerebellum-referenced Logan outcome in three prespecified regions.
The result: a region-by-session interaction, driven by the thalamus, where binding fell in eight of the nine participants included in that comparison, by between 2 and 36 per cent, with a within-person effect size of −0.99 . The nominal p value was 0.021, which became q = 0.063 under the authors' stated false-discovery threshold of q < 0.1 — it meets the threshold the authors declared, and it would not meet the more common one. Amygdala and hypothalamus were null. The dose-response hint, a negative association between salivary cotinine and thalamic binding, involved seven participants and did not reach significance .
13 → 10
recruited, then analysed, in the human cetrozole series
9 / 8 / 7
denominators inside the nicotine paper (thalamic test / sensitivity analyses / cotinine correlation)
1
participant with the arterial comparison that speaks to reference-region behaviour
20.4 min
half-life of carbon-11, which is why the whole measurement has to finish inside about an hour and a half
The authors' reading is direct enzymatic blockade, and it is a reasonable one: nicotine and its metabolites inhibit aromatase in cell preparations, an effect relieved by an excess of the enzyme's own substrate (Barbieri 1986) , and an earlier primate study with the predecessor tracer reported the same direction, in the region where that species carries most of the enzyme (Biegon 2010) . Convergence across species and across two tracers is genuinely encouraging for the claim that the signal is aromatase-related.
It is a different claim from the one the chapter is about. A fall in binding is consistent with occupancy of the site by something else; it is not a measurement of a change in estradiol production. The paper says so. What is harder to keep in view is the second interpretation, and it comes from the study's own supplement.
In the one participant who had arterial sampling in both sessions, tracer volume of distribution fell after nicotine in every region examined — including the cerebellum, the tissue used as the reference . The authors read this as evidence that the reference-based effect is an underestimate, because a reference that falls alongside the target hides part of the target's change inside the ratio. That reading is sound. It is also exactly the observation a moving denominator would produce, and with one participant neither reading is established . This is the single most load-bearing gap in the chapter: the supplementary material that contains it was cited by the article and could not be obtained here, so it stays a named gate rather than a resolved question .
Deep dive: why one arterial dataset cannot settle the reference question
The outcome in this literature is a distribution-volume ratio minus one. If the target region's total distribution volume is Vt and the reference region's is Vr, the reported binding is Vt/Vr − 1. Both terms can move, and the reported number depends on their ratio, not on either one.
An explicitly hypothetical worked example, in arbitrary units. Suppose a target region starts at Vt = 1.30 and a reference region at Vr = 1.00, so the reported binding is 0.30. Now suppose a challenge lowers the target by 15 per cent, to 1.105, and ask what three different reference behaviours do to the number that gets published:
- the reference is unchanged: reported binding falls from 0.30 to 0.105, a 65 per cent drop;
- the reference falls by the same 15 per cent: the ratio is untouched and the reported binding stays at 0.30, even though the target really did change;
- the reference falls by 20 per cent, to 0.80: reported binding rises to 0.38.
These numbers are invented to make the arithmetic visible. They are not taken from any study and they are not a reanalysis of one. The point is only that the three outcomes are produced by one and the same change in the target, and that distinguishing them requires knowing what the reference did — which is what the arterial comparison would supply if it existed for more than one person .
One more source-level detail stays visible rather than being tidied away: the article describes nicotine as the second session for everyone, while the thesis figure describing the same protocol says the order of the two sessions was randomised . For a within-person design with one cycle between visits, session order is not a cosmetic detail, and the two descriptions cannot both be complete.
Four questions about one enzyme, and no ladder between them
Expression, protein, reachable sites and catalytic rate are four different experiments. Each is informative. None of them delivers the next, and a study that passes one has not passed the others.
Four questions about one enzymeFour evidence types · not a validation chain
01 · Expression
Is the gene being transcribed, and in which cells?
in-situ hybridisation, sequencing
In the rat brain the transcript sits mostly in GABAergic neurons, highest in the medial amygdala and the bed nucleus of the stria terminalis.
Cannot settle how much protein is present, or whether any of it is working.
a transcript is not a protein
02 · Protein
Is the enzyme itself there, in this tissue?
immunohistochemistry, antibody assays
Aromatase protein has been reported in the human hippocampus — a region where the PET studies here saw no reliable signal.
Cannot settle how much of the protein a ligand can reach in a living brain, nor its rate.
a protein is not a reachable site
03 · Availability
How many sites can a ligand reach, in vivo, in an hour?
PET with a labelled inhibitor
Cetrozole binding above the noise threshold in thalamus, amygdala and hypothalamus, read against a cerebellar reference.
Cannot settle the rate of product formation; it inherits every assumption about delivery and the reference.
an occupied site is not a turnover rate
04 · Activity
How fast is androgen actually becoming estrogen?
product-formation assays in tissue
Classically, the labelled water released as the androgen is converted. No human work in this chapter performs it.
Done in tissue, not in a living person — which is exactly the gap imaging is wanted for.
The same four questions recur elsewhere in this report: an engineered receptor construct is a detectable target rather than a native one (chapter 1), surface and total receptor pools are different quantities for synaptic tracers (chapter 4), and a neuroimmune binding site is not a cell count (chapter 5).
The expression work behind the first column is in rats, and it is unusually specific: aromatase transcript is sex-, region- and cell-type-dependent, found mostly in inhibitory neurons, with higher expression in males across several limbic regions . That is a result about cells, in a species whose aromatase geography differs from ours. It tells us what kind of cell the human signal might be coming from; it does not tell us that the human signal comes from there.
The clearest illustration of the gap between columns is the hippocampus. Aromatase protein has been reported there in human tissue, and yet neither of the two human PET studies in this programme could measure reliable availability in that region: the signal sat below the threshold they treated as usable . Nothing is contradictory about that. A tracer that cannot resolve a low-density region is reporting its own detection limit. The error to avoid is the easy one: a failure to quantify is not a demonstration of absence, in this region or any other.
The third column, availability, is also where the multimodal arm of the same programme sits. In twenty-one women, aromatase availability in the thalamus, amygdala and hypothalamus correlated with regional grey-matter volume, and inversely with the volume and thickness of several prefrontal subregions; hypothalamic availability was related to the volume and microstructure of the fornix . Those correlations are interesting and they are not an endocrine result: no relation was found between availability and menstrual cycle phase, or between availability and circulating hormone levels. That study was an unpublished manuscript at the time of the thesis, and this review could not establish its current publication status .
A peripheral negative result, read as the four experiments it was
The endometriosis study is the most useful negative result in this chapter — and only while its four separate experiments stay separate.
Zhang 2026 set out to find a PET tracer for endometriotic lesions, and had three candidates for three different features of the disease: aromatase, which is raised in lesions and nearly absent from healthy endometrium; neutrophil elastase, as a marker of the inflammatory infiltrate; and a receptor marking the fibrotic process. Ten biopsies from nine patients were sectioned and exposed to the tracers with and without a blocking agent, alongside histology on nearby sections. One tracer was then taken into a small imaging study in patients.
Anatomy of a negative resultFour experiments, four conclusions
ExperimentWhat it didResultWhat it cannot settle
Aromatase tracer, tissue sections
Initial stage only: sections from 4 patients, blocked with letrozole at 20 µM (two experiments) or 100 µM (one), and with unlabelled cetrozole at 20 µM (one).
No consistent reduction in binding under blocking. One experiment at the highest letrozole concentration reached p = 0.0436; it did not recur.
Whether aromatase was present at all: the confirmatory stain for this target was not performed.
Elastase tracer, tissue sections
All 10 sections, blocked with a selective elastase inhibitor, with staining for elastase and for a histone marker of extracellular traps.
Binding consistently reduced under blocking, significantly so in six of ten whole sections and in the high-uptake spots; staining confirmed the target.
Whether the tracer reaches the lesion in a living patient.
Fibrogenesis tracer, tissue sections
Sections from 4 patients, blocked with the unlabelled peptide, with stains for the receptor and for mature fibrosis.
Binding fully blocked, with supporting histology on the same material.
Anything in vivo: this tracer was not yet available for patient use.
Imaging pilot, in patients
3 women with ovarian endometrioma, scanned with the elastase tracer — not the aromatase one — on a combined PET and MR system.
No uptake at the lesions; lower than in muscle, while bone marrow behaved as expected. The study was stopped.
Why. Delivery into fibrotic tissue is the authors' hypothesis; perfusion was not measured.
Collapsing these four rows into one sentence produces a claim that none of them supports.
The aromatase row is the one this chapter needs, and it is a careful negative. Binding was visible on the sections, but it did not fall when the site was blocked — and the test was run only in the first, four-patient stage, with a handful of blocking conditions. The authors say plainly that visible uptake without blockable binding cannot be called specific aromatase binding. What makes the result hard to interpret further is the missing step: the confirmatory stain for aromatase was not performed, so there is no independent evidence about whether the target was present in the sections where the blocking failed . Staining performed for other targets does not substitute.
Four gates are visible in this one paper, and they fail independently: is the target plausibly there (expression and pathology say yes for aromatase in lesions); is it confirmed in this tissue (not tested); does the tracer bind it displaceably (not shown here); and does the tracer reach the tissue in a living person (not shown, for a different tracer, in three people). A failure at one gate says nothing about the others .
Null resultA blocking experiment that fails is not a target that is absent. It is an experiment that did not identify its target — which is also what a missing target, a wrong concentration, a degraded section or an unsuitable assay buffer would produce.
Three sentences are therefore unavailable, and all three are easy to write by accident. That the aromatase tracer failed in patients: it was never given to a patient in this study. That brain aromatase imaging is in doubt because a peripheral assay was negative: lesion tissue and brain tissue are not interchangeable, and an autoradiography assay is not a scan. And that the negative imaging pilot tells us anything about aromatase: it used a different tracer against a different target . The authors are explicit about the structure of their own study; it is the summary of it that tends to collapse.
What the study does establish is worth stating positively, because it is the template this chapter recommends. Two of the three tracers showed specific, blockable binding with histological confirmation on adjacent material. For one of them, that in-vitro success was followed by an in-vivo null with internal controls behaving correctly, which is exactly the configuration that isolates delivery as the next thing to measure — and the authors propose doing so with a perfusion tracer rather than asserting it .
Inactivation is the other half, and here it is a hypothesis
Estrogen is also switched off locally, by sulfonation. The imaging evidence in this branch is computational, it is early, and it points at a reference region rather than at estrogen.
Sulfotransferases attach a sulfonate group to hormones, neurotransmitters and xenobiotics, which is one of the ways a tissue takes a molecule out of play. One member of the family, SULT1E1, is the estrogen-specific one, and it is the reason this branch belongs in a chapter about local estrogen handling: the enzyme that makes estradiol and the enzyme that inactivates it together set what a region is exposed to, independently of what is in the blood .
The route into imaging is unexpected. Earlier chemistry work identified this estrogen-inactivating enzyme as a binding partner of the amyloid tracer scaffold built on thioflavin — Cole 2010, which this review could reach only as indexed excerpts, an access gap in this work rather than a statement about the article. Miccoli 2026 asked whether the fluorinated derivatives in clinical use share that liability, using public expression data, molecular docking and 300-nanosecond simulations against deposited and predicted enzyme structures.
Two of its findings matter here. The first is a correction to the premise: in the transcript datasets analysed, the estrogen-specific isoform was negligibly expressed in the adult human cortex, while three other family members were abundant — the opposite of what the earlier work reported, which the authors attribute partly to antibodies that may not distinguish between closely related family members . The second is where those three abundant isoforms sit. They are expressed in the cerebellum: the region used as the reference for amyloid imaging .
Where the inactivation hypothesis lands
target regiontracer bound to its intended target, plus whatever else it binds
÷
reference regionassumed to carry no signal of interest
the enzymes in question are expressed in both
A structural prediction about an off-target enzyme is a question about the denominator before it is a question about the numerator — and the authors state that their work cannot say whether the effect on either is large enough to matter.
The authors are careful about what this is, and the carefulness should survive the retelling. Simulations assess whether a pose is physically plausible and stable; they do not establish that a molecule gets into a cell at a sufficient concentration, that it competes successfully with whatever is already in the pocket, or that any of it registers in an image. Transcript abundance is not protein abundance, protein abundance is not occupancy, and occupancy is not signal. The paper states explicitly that it cannot determine whether these interactions affect reference-region activity or the scales derived from it .
The supporting material for this branch is thin in a way worth marking rather than hiding. The chemistry work that anchors the whole branch was available here only in indexed form. A human study that followed it, Surmak 2020, is known to this review as a citation inside the later paper and nothing more; no outcome from it is used here . The computational work's own deposited data — a single processed project file of binding energies and trajectory deviations, under a permissive licence — was inventoried but not opened or reanalysed .
HypothesisIf an estrogen-inactivating enzyme family shares a binding pocket with a widely used tracer, then two literatures that never cite each other may be sharing a measurement channel. That is a reason to test the overlap experimentally. It is not a reason to read an amyloid image as a measure of estrogen metabolism, and nothing in this chapter supports doing so.
Which quantity would an endocrine contrast move?
Before designing a study of ovarian state and local synthesis, it is worth saying out loud which of the three quantities the design moves, and which of them the scanner can see.
The evidence so far is quietly consistent, and it points the wrong way for an easy study. Across the cycle, Biegon 2015 reported that ovarian tracer uptake varied while no corresponding brain difference was detected . In the twenty-one-woman multimodal study, availability was unrelated to cycle phase and to circulating hormones . And in Dubol 2026, a later challenge with the same tracer, one week of transdermal testosterone — an exposure that raises the enzyme's own substrate — produced no statistically significant corrected change in binding in ten women .
Three negatives of that kind invite one of two readings, and the honest position is that both remain open. Either the enzyme pool is genuinely not moved much by ordinary endocrine variation on these timescales — in which case aromatase availability is a trait-like measure rather than a state measure, which would be useful to know and would change what it is good for — or the measurement is not sensitive to what did change. None of these studies performed an equivalence analysis, and none had the sample size to support one, so "no detected difference" is as far as they go .
The interactive below is a toy, and it exists to make one relationship concrete: the levers that move an enzyme's output and the levers that move its tracer signal are not the same levers, and one of them moves them in opposite directions.
Move the enzyme, the substrate supply and a competitor
Schematic · arbitrary units · no fitted values
What the tracer can see sites it can occupy
What the tissue is doing estradiol produced per unit time
0starting statedouble
The uncomfortable case is the last of those three. An endocrine manipulation that changes how much androgen is available to the enzyme changes its output directly, and may change the tracer signal in the opposite direction, because the tracer and the substrate are competing for the same pocket . A design that measures only binding cannot tell that case apart from a change in the amount of enzyme. This is the same structure as the competition problem in chapter 1, with the roles reversed: there, the endogenous hormone competes with the tracer at a receptor; here, the endogenous substrate competes with the tracer at an enzyme.
What would make the next measurement decisive
Four observations would separate the readings this chapter has kept apart. None of them requires a new tracer, and two of them are already half-done.
Reference behaviour under the challenge, in more than one person. The single arterial dataset inside the nicotine study is the cheapest discriminator in the chapter, and it is also the one piece of evidence that would decide between "the effect is underestimated" and "the denominator moved" . Obtaining the supplement is a source-level task; acquiring arterial or image-derived input in a handful of participants is a small methodological study, not a new programme.
A test–retest in the relevant population. Without a figure for how much the measure moves on its own, an endocrine group difference has no yardstick, and a null has no interpretation . This is the step that would turn the three negatives above into either a useful trait finding or a statement about sensitivity.
An orthogonal handle on synthesis, measured at the same time. The whole argument of this chapter is that binding and production are different quantities; the way to stop arguing about it is to measure both. Substrate and product concentrations in blood, a tissue activity assay where tissue is available, or an exposure designed to move the substrate rather than the enzyme would each give the binding measurement something to be checked against .
Target confirmation in whatever tissue carries the assay. The endometriosis work makes the case by omission: a blocking failure with no confirmation of the target is an uninterpretable result, where the same experiment with a stain attached would have been a clean one .
There is also a question that stays entirely inside what already exists, which makes it a plausible opening for a collaboration rather than a proposal for a new study: whether the existing cetrozole sessions can be re-read with the reference region treated as an unknown instead of a constant. That is a modelling question asked of data that are already collected. It is not an open-data question — the participants in this series did not consent to public sharing of their data, which the methods paper states — so it would have to be asked of the investigators who hold them, and framed as a methods collaboration rather than a request for a dataset .
What to carry forwardAromatase imaging is the most direct hormone-related enzyme measurement in this report, and it is also the clearest example of the distinction the whole report turns on: a quantity that is measurable is not automatically the quantity that is wanted. The inactivation branch is one step further back, at the stage of a structurally motivated hypothesis.
What this chapter does not show
- That brain aromatase PET measures local estradiol production, or any other rate.
- That the nicotine result has been reproduced in an independent group of people: the methods paper, the challenge paper and the thesis chapter describe one analysed group of ten.
- That the cerebellum carries no specific aromatase binding, or that it stays unchanged during a challenge. One participant's data are consistent with it changing.
- That cetrozole has failed as a brain tracer. A peripheral autoradiography assay without target confirmation, and a negative pilot using a different tracer against a different target, do not establish that.
- That amyloid tracers measure estrogen metabolism, or that the sulfotransferase interaction has been demonstrated in a living person. The evidence here is expression data plus simulation.
- That ovarian state does not affect brain aromatase. Three small studies detected no difference and none of them tested for equivalence.
03
Endocrine trajectories
Endocrine trajectories matter as much as the choice of tracer
“Low estrogen” is not one experimental condition. Natural cycles, abrupt surgical loss, gradual follicular depletion, suppression, contraception, replacement and postpartum withdrawal change different hormones on different clocks, so two studies with the same tracer can be answering different questions. The design fixes the contrast before the scanner measures anything.
ObservedRodent FDG studies of abrupt ovariectomy with immediate estradiol and of gradual VCD depletion report uptake differences; a small human dual-tracer estradiol study posts only before-and-after summaries.
AttributionEach design identifies a different contrast, and anaesthesia, injection route, normalisation and hormone verification differ too, so the results cannot sit on one estrogen scale.
DiscriminatorArms that separate prevention, withdrawal, adaptation and delayed rescue in one model, with hormones measured at every scan and the reference region checked.
Next questionWhich contrast does a proposed scan identify, and when, relative to the endocrine transition, is it taken?
There is no single “low versus high estrogen” contrast
Seven familiar endocrine states and manipulations change different hormones over different timescales. Lining them up on one low-to-high axis hides what each design can estimate.
Natural cycles move estradiol and progesterone together over weeks; a menopausal transition stretches irregular cycling over years. Bilateral ovariectomy removes the ovaries in one operation, so the loss is abrupt by construction. Chemical follicular depletion with VCD leaves the ovaries in place and empties the follicle reserve over months: in one rat study, cycles stayed regular in the cohorts examined at one and two months and became irregular only at three .

Pharmacological designs perturb an axis rather than one hormone. A gonadotropin-releasing-hormone agonist implant produced what Frokjaer 2015 describe as a biphasic fluctuation, stimulation followed by suppression . A combined oral contraceptive suppresses the natural cycle while adding a synthetic estrogen and a progestin; the Pill Project's formulation is 30 µg ethinylestradiol with 150 µg levonorgestrel . Replacement raises estradiol from a low baseline: FEMME titrated a transdermal patch toward a target serum range . Postpartum studies scan in the days after delivery, where their authors place the fall in estrogen that follows late pregnancy .
None of these is better than the others in general; each supplies a different comparison. “Low estrogen” a fortnight into suppression, decades after surgical menopause and three months after VCD are three different biological states, in different species, under different measurement conditions.
The scan moments matter as much as the curves. Khayum 2020 scanned the same rats 13 and 60 days after surgery; Ramli 2024 scanned a different set of rats at each of three times; the menopause-stage and postpartum studies scanned each person once. A within-animal change, a between-cohort difference and a between-person difference are three different estimands, even with the same tracer and region .
Two rodent experiments, two different questions
Khayum 2020 tests what estradiol given at the moment of surgery prevents. Ramli 2024 compares stages of gradual depletion in separate cohorts. Each leaves out the experiment the other seems to supply.
In Khayum 2020 all 32 young adult female Wistar rats were ovariectomized (OVX) on day 0 and given an estradiol or placebo pellet at once, then crossed with chronic mild stress or control housing: four groups of eight . FDG PET followed on days 13 and 60, with stress from day 17. There was no sham or intact group and no delayed estradiol . The design identifies estradiol present versus absent in animals that have all lost their ovaries, a prevention contrast. It is not OVX versus sham, and it does not test whether estradiol reverses a state that has already developed .
32 · 4 × 8
rats, all OVX, in pellet × housing groups
13 · 60
days after surgery, PET in the same rats
30 · 5
VCD study rats · per arm per timepoint
Ramli 2024 asked something else. Rats aged three months received VCD or vehicle daily for 15 days, ovaries left in place, and were split into separate cohorts examined one, two or three months after the final injection: 30 rats, five per arm per timepoint . Cytology followed every group, but serum hormones and follicle counts were measured only at three months, where the authors report lower estradiol, progesterone and anti-Müllerian hormone, higher FSH and fewer follicles . The earlier stages have no measured hormone levels, and because each stage is a different set of animals, the design compares stages between cohorts rather than following a transition within any animal . The authors chose this layout to avoid learning effects from repeated water-maze testing .
Khayum 2020 identifies
Estradiol versus placebo from the moment of surgery, in animals that are all ovariectomized, measured twice in the same animals.
It cannot show the effect of OVX itself (no sham) or delayed rescue (no late-start arm).
Ramli 2024 identifies
VCD versus vehicle at three depletion stages, each stage a separate cohort, ovaries retained.
It cannot show a within-animal trajectory, or hormone levels at the first two stages.
The measurement conditions differ as much as the endocrine design
Khayum 2020 gave FDG intravenously under brief isoflurane and let the rats take it up mostly awake, reporting SUV; Ramli 2024 gave it intraperitoneally after a fast, under continuous isoflurane, reporting SUVR against the cerebellum . A fasting or glucose-correction step was not identified in the Khayum PET methods, and its stress schedule includes food and water deprivation . The “physiological” estradiol exposure attributed to the pellets is the authors' description, not a measured serum level. Each of these differences is a separate route by which two FDG numbers can diverge . Body weight diverged too: by the end, control-housed placebo rats had gained 56.2 ± 5.7 g against 10.4 ± 7.0 g with estradiol, which matters for a weight-normalised SUV without showing that the findings are artefacts .
Worked example · hypothetical numbersSuppose hippocampal FDG uptake did not change at all in some VCD experiment, while uptake in the cerebellar reference rose by 5%. Hippocampal SUVR would fall from 1.00 to 1/1.05 ≈ 0.952, a drop of about 4.8% made entirely by the denominator. Khayum 2020 reports lower cerebellar uptake in placebo than in estradiol rats at day 13 : a reason to check reference behaviour in endocrine studies, not evidence that the denominator changed in Ramli 2024.
| Dimension | Khayum 2020 | Ramli 2024 | FEMME |
|---|---|---|---|
| Hormone verification | Terminal uterine weight; no serum estradiol assay identified | Daily cytology; serum hormones and follicles in the final cohort only | Planned serum estradiol at baseline, week 2 and follow-up, with titration |
| FDG conditions | Intravenous, brief anaesthesia, mostly awake uptake; static scan 45–75 min | Intraperitoneal after ≥ 12 h fast; continuous isoflurane; 30-min uptake, 30-min scan | Fasting; dynamic acetoacetate then FDG; heated-arm venous samples |
| Measurement | SUV (body weight, dose), not an absolute metabolic rate | Cerebellum-normalised SUVR, not an absolute metabolic rate | Absolute uptake and ketone-to-glucose ratios proposed; model referred to earlier methods |
| Main limit | Immediate replacement: not OVX versus sham, not delayed rescue | Stages between cohorts; early stages lack hormone assays | Non-randomised, unblinded, no untreated control |
Documented discrepancies stay visible
The full texts contain internal inconsistencies, recorded here as found, checked against the rendered pages and not repaired. None alone invalidates a study; together they are why the regional values are neither pooled nor digitised .
| Source | Location | What conflicts |
|---|---|---|
| Khayum 2020 | Figure 4 caption | n = 16 per group for panels A and C, but panel C has four groups; the design and panel D use n = 8 |
| Khayum 2020 | Table 4 | Header says day 16; caption and PET methods say day 13 |
| Khayum 2020 | Table 3 | Title says 48 days of stress; methods describe six weeks, days 17 to 59 |
| Khayum 2020 | Tables 2 and 3 | Cluster p and peak T values with no matching cluster pipeline in the methods; abstract wording on regional direction does not map onto every table contrast |
| Ramli 2024 | Results, PET | Lower hippocampal SUVR at three months, then no effect “in group 2 and 3”; Figure 12A marks only three months. A label typo is plausible, not confirmed |
| Ramli 2024 corrigendum | Notice | Changes an author affiliation only |
A human study that asks about fuel, not only glucose
FEMME paired FDG with carbon-11 acetoacetate before and after eight weeks of transdermal estradiol. It is a valuable measurement precedent with a small, uncontrolled denominator, not evidence of an estradiol effect on fuel choice.
FEMME (Female Estrogen Menopause Mind and Energy; NCT03681691) studied postmenopausal women aged 60 to 80, with or without type 2 diabetes, at Wake Forest . Its rationale was the healthy-cell-bias idea that estradiol may help glucose-using cells but act differently on metabolically stressed cells that lean on ketone bodies . Both groups wore an estradiol patch for eight weeks, titrated after a week-2 serum check, with PET at baseline and week 8. The protocol states there was no randomisation or blinding, because diabetes cannot be assigned .
The imaging is the interesting part: carbon-11 acetoacetate with a 30-minute dynamic acquisition, a washout, then FDG for 60 minutes, with venous samples from a heated forearm . Two tracers in one sitting can ask whether a change in glucose uptake comes with a change in ketone uptake, which one FDG image cannot .

The posted results show how far the analysed sample sits from the plan. Twenty women were planned; 12 enrolled (8 with diabetes, 4 without), 9 completed, and the primary PET outcomes report 8, six with diabetes and two without .
with type 2 diabeteswithout type 2 diabetesbar length: out of the planned 20
20Planned in the protocol
10 per group (protocol, version 8)
12Enrolled
actual enrolment
9Completed the study
left: COVID, prolonged bleeding, veins would not stay open for PET (1 each)
8Primary PET outcomes
one image lost to a reconstruction error
Denominators change by module
8 (6 / 2)FDG and acetoacetate uptake, baseline and week 8
9 (6 / 3)cognitive scores
0registered change outcome: no change values posted
—ketone-to-glucose ratio: no results listed
Four limits follow from the design and the posting, not from any judgement of the investigators. With no untreated comparison, a week-8 difference cannot be separated from time or repeat scanning. Diabetes was not randomised, and the group without it is two women in the primary PET outcomes. The registry gives timepoint means and standard deviations but no paired change, so the paired covariance needed for within-person change is unavailable. And the protocol framed acetoacetate relative to FDG as a way “to find potential areas of compensatory ketone use”, yet the pre-specified ketone-to-glucose ratio has no posted result . Nothing posted demonstrates a compensatory fuel shift .
The dual-fuel idea reappears in a registry lead. MOSAIC (NCT07021664), sponsored by the Université de Sherbrooke, plans a cross-sectional comparison of about 45 women aged 35 to 60 across the menopausal transition, with carbon-11 acetoacetate and FDG PET and fluorine-18 4FMFES receptor PET as a secondary measure . Its record still reads “not yet recruiting” with a passed estimated start, so it shows neither recruitment nor results; by design it would identify stage associations, not an estradiol effect .
Deep dive: what the FEMME protocol does and does not pin down
The plan quantifies absolute global and regional uptake of both tracers after registration to MRI, citing the collaborators' 2014 young-versus-older-adult comparison for the method; the sections read do not spell out the input, kinetic or correction pipeline . About three carbon-11 half-lives (20.4 minutes each) separate the two injections, so residual carbon-11 is much reduced but not zero when FDG starts; its handling is not stated . The dose wording mixes mCi and MBq inconsistently and is not reproduced. No linked journal report was found in a bounded search, which does not mean none exists.
Suppression and contraception: controlled, but never estradiol alone
Randomised suppression and randomised contraception give real causal leverage, but each moves the whole reproductive axis. The concrete resources here are a stale registry entry and a controlled-access dataset.
The Pill Project (NCT05212389), at the Neurobiology Research Unit in Copenhagen, registered a randomised, participant-blinded comparison of a combined pill with placebo over three cycles in healthy women aged 18 to 22, with change in neostriatal, neocortical and hippocampal 5-HT4 binding as the primary outcome and an estimated 40 participants . It follows cross-sectional work in which pill users had lower global 5-HT4 binding (Larsen 2020), an association that cannot separate the pill from who chooses it . The registry status is UNKNOWN, last verified February 2022, with no results posted; individual data are expected from December of 2026, after publication and subject to approval and a signed agreement . The investigator page gives ages 18 to 25, and the discrepancy is kept. Even with results, the randomised contrast is the whole formulation: suppression plus a synthetic estrogen and a progestin.
Frokjaer 2015 randomised 63 healthy women to a goserelin implant or placebo, double-blind; 60 completed, with carbon-11 DASB serotonin-transporter PET in the follicular phase at baseline and about 16 days after the intervention began . The authors report that depressive symptoms emerged, tracked the net fall in estradiol, and were associated with increases in neocortical transporter binding relative to placebo . It is one of the strongest designs in the human map, and still a suppression of the axis after an initial stimulation, not an isolated estradiol withdrawal.
A controlled-access repository, PN000018, lists this study with 63 participants, anatomical and PET data and 39.54 GB, behind a Data User Agreement . It is an access route to an existing study, not a new cohort or 63 proven scan pairs; its variables are unknown, its displayed BIDS version is malformed, and no access has been requested .
Publication is not replication here either
The contraception preprint Kauffmann 2025 states that its altanserin sample includes the original 29 participants of Frokjaer 2009 plus ten more, so it is not an independent replication of that comparison . A 2009 conference abstract, Sacher 2009, describes 15 women at days 3 to 6 and 8 at weeks 2 to 8 postpartum, reporting that monoamine oxidase A binding normalised after the first week; the journal article, Sacher 2010, reports only the early comparison. Whether the later eight were rescans, a separate sample or ever published is unresolved .
Which contrast does each design identify?
Sorted by what they can identify, the designs spread across six contrasts. No design fills every column, and random assignment of a hormone is rare.
Figure 3.3 places twelve designs against six contrasts: exposure (hormone present or absent at the scan), suppression (pharmacological lowering of the axis), withdrawal (a transition observed across the fall), replacement (hormone added back to a low state), adaptation (change with time in a state) and association (states nobody assigned). Marks come from assignment, timing and comparator, not from evidence counts or effect sizes .
| Design | Exposure | Suppression | Withdrawal | Replacement | Adaptation | Association | Cannot separate |
|---|---|---|---|---|---|---|---|
| Natural cycle, within personPetersen 2021; Sacher 2023 | Estradiol from progesterone; order and time | ||||||
| Menopause stage, cross-sectionalMosconi 2024 | Stage from age | ||||||
| Surgical menopause, years laterZeydan 2019 | Surgery, later treatment, age, duration | ||||||
| All-OVX, immediate estradiol or placeboKhayum 2020 · rat | OVX itself (no sham); delayed rescue | ||||||
| VCD versus vehicle, separate cohortsRamli 2024 · rat | Within-animal progression; early hormones | ||||||
| GnRHa versus placebo, randomisedFrokjaer 2015 | Estradiol from the rest of the axis | ||||||
| Pill users versus non-usersLarsen 2020 | The pill from who chooses it | ||||||
| Combined pill versus placebo, randomisedPill Project · registry only | Suppression from the added hormones | ||||||
| Estradiol ± progesterone versus placeboKranz 2014 · randomised | Initiation timing (not varied) | ||||||
| Therapy continued versus stoppedRasgon 2014 · randomised | Original initiation and formulation | ||||||
| Estradiol in both groups, before and afterFEMME | Estradiol from time; diabetes from its correlates | ||||||
| Postpartum early windowSacher 2010 · cross-sectional | Withdrawal from other postpartum change |
identified by the designpartly, or entanglednot identifiedopen: abstract-only later windowdiscussed in this chapter
Two patterns stand out. Filled marks for exposure, suppression and replacement come from designs that assign the hormone; association is filled by designs that do not. And withdrawal is the hardest contrast to isolate: the randomised discontinuation of Rasgon 2014 comes closest, while the GnRHa and postpartum designs reach it only partly, because the whole axis, or all of postpartum physiology, moves with estradiol . Neither rodent study gives estradiol after a delay, and no row compares early with late initiation in one model, which a timing question would need.
The human study map holds 73 rows: 26 hormone-therapy or administration rows (plus four experimental-administration and estrogen-use rows), 14 menstrual-cycle, 10 menopause-stage, 6 contraception, 4 pregnancy and postpartum, 3 gender-affirming, 3 direct-target validation, 2 surgical menopause and 1 ovarian suppression. Twenty-nine are associations (27 cross-sectional, 2 comparisons of treatment users); only five involve random assignment, and those come from four trials, because two rows share the KEEPS trial (Kantarci 2016; Kantarci 2026) .
Interactive explorer of the 73 map rows (needs JavaScript).
Prevention, withdrawal, adaptation and rescue are different experiments
Four questions hide inside “what does estrogen loss do to the brain?”, and each needs its own comparison and its own scan timing.
Prevention asks what changes when the hormone is kept present from the moment it would have been lost. Withdrawal asks what happens across the fall, which needs the same animal or person measured before and after, ideally against a group that does not fall. Adaptation asks what changes with time in the low state, which needs repeated measurement after the fall. Rescue asks whether restoring the hormone after a delay reverses what adaptation produced, which needs the adapted state shown first and a late-start arm compared with an untreated one .

The rodent pair shows why this matters. Lower uptake at day 13 in placebo-implanted rats, compared with estradiol-implanted ones, is a prevention contrast at a short interval. Lower hippocampal SUVR in a three-month VCD cohort, compared with its vehicle cohort, is a depletion-stage contrast between animals. A day-13 to day-60 change in the placebo arm would be adaptation, but half of those animals were stressed between scans. None is a rescue contrast, and agreement or disagreement in direction between them cannot by itself identify a mechanism .
Hypothesis · one design that identifies all four (illustrative, not ready to run)
Separate behavioural cohorts could protect the imaging timeline from the learning effects Ramli 2024 avoided. One anaesthesia protocol, measured glucose and blood-based input or a reference check would keep measurement conditions from posing as endocrine effects. Power, ethics review and any tracer beyond FDG need their own assessment .
| Contrast | Comparison that isolates it | Measured at every scan |
|---|---|---|
| Prevention | OVX with estradiol from surgery versus OVX with placebo, both against sham | Serum estradiol; one fixed uptake protocol |
| Withdrawal | The same animals scanned before and early after surgery, sham as control | Hormones; reference-region uptake |
| Adaptation | Repeated within-animal scans after OVX with placebo, and across a VCD transition | Hormones, body weight, blood glucose |
| Rescue | Estradiol started after the adaptation scan versus continued placebo | The adapted phenotype first, then change |
Human analogues exist for parts of this grid: randomised estradiol add-back during GnRHa suppression would turn suppression into replacement within one axis state; randomised discontinuation identifies withdrawal; repeated postpartum windows in the same women would separate the early fall from what follows. These are hypotheses about design, not proposals for anyone's facilities .
What a first collaboration could map
The cheapest useful next step is a ledger of what existing studies actually manipulated and measured, built before any new scan is planned.
For a small set of original studies, such a ledger would record exposure composition, timing relative to the transition, which hormones were measured and when, tracer and signal model, normalisation and reference, paired completeness, controls and cohort genealogy . It needs no scanner or participant data; its output would be the contrasts the literature identifies and two or three hypotheses worth testing.
Resources sit in different states: the FEMME protocol is public and its results are marginal summaries; the GnRHa repository is controlled and its variables unknown; the Pill Project may share data from December of 2026, under conditions. GSE268557 deposits hippocampal arrays from VCD and control mice in a 3xTg-AD model, with 28 sample titles in groups of 8, 6, 6 and 8; nothing has been downloaded, and it is target biology, not PET . Which of these a collaboration should take up, as a synthesis, an analysis or a new design, depends on its interests and access, which this review does not assume.
What this chapter does not show
- That abrupt OVX is natural menopause, or that VCD depletion in young rats reproduces a human perimenopause.
- That immediate replacement after surgery tests delayed rescue.
- That a registry enrolment count is an analysed sample, or that a controlled-access listing is open data.
- That FEMME's uncontrolled before-and-after design yields a treatment effect or a compensatory shift to ketones.
- That the rodent regional FDG results agree or disagree in a way that identifies a mechanism.
04
Downstream windows
Downstream molecular imaging offers many windows on endocrine response
Seventy-three rows of human imaging, from serotonin receptors to tau, show ovarian state leaving traces across many systems. Each window answers its own question on its own clock; most rows are associations, not interventions; and the newest branches are directions to test, not results to cite.
ObservedA 73-row human map spans serotonin, dopamine, opioid, cholinergic, metabolic and pathology imaging across eleven endocrine contexts, with positives beside many small nulls.
AttributionMostly weak and always tracer-specific: 29 rows are associations (27 cross-sectional, 2 treatment-use comparisons), five are randomized, and few designs isolate estradiol.
DiscriminatorA defined endocrine contrast, a tracer whose estimand and clock fit it, repeatability in comparable women, and an orthogonal assay.
Next questionCan one downstream window, monoamine, inhibitory or AMPA, be tied to a controlled endocrine contrast with metabolite and reference evidence?
Seventy-three rows, read as a map
The human study map is a coverage instrument. It shows where molecular imaging has looked at ovarian state, not how strongly any answer is supported.
It was assembled in an earlier pass of this project from a 2025 systematic review of human non-clinical studies (Walsh 2025), extended with clinical and more recent work, and cross-checked against primary sources. Each row records one study or analysis: endocrine state, design, tracer, estimand, sample size, finding, attribution limit, cohort links and reading depth. The rows were not re-read for this report; later source checks are flagged inside the rows they change.
The map is uneven: hormone therapy or administration holds 26 rows, ovarian suppression one. It is mostly observational: 29 association rows and 25 within-person contrasts against five randomized rows. And it is mostly read at abstract level: 47 rows rest on primary abstracts alone and one on an abstract with partial methods, against 20 read in full text and five from review extraction or metadata.
73
map rows, drawn from 71 publications
32
rows image downstream neurotransmission
5
rows randomize a hormone exposure
47
rows read at primary-abstract level only
Rows are not independent studies. Both Jovanovic 2009 rows come from one paper, as do the FDG and amyloid rows of Mosconi 2021. Moses 2000 and Moses-Kolko 2003 analyse the same five women, and three rows each descend from one Ottowitz infusion programme, from the NCT00097058 trial and from KEEPS, the Kronos Early Estrogen Prevention Study. A later check found that the Kauffmann 2025 preprint reuses the 29 participants of Frokjaer 2009 .
Interactive atlas of the 73 map rows; it needs JavaScript.
The sections below walk the atlas by system, giving the strongest or most instructive rows more room, then turn to three branches the map predates: inhibitory signalling, AMPA receptors and synaptic density.
Each tracer class keeps its own clock
Receptor snapshots, challenge displacement, enzyme trapping, transporter binding, glucose use and amyloid accumulation answer different questions, each on its own timescale.
Baseline availability (BPND or VT) is a snapshot at the scan. A difference between states can reflect receptor number, affinity, the tracer’s free fraction, delivery, the reference tissue and, for some tracers only, competition from an endogenous ligand. The map records antagonist 5-HT2A tracers as generally insensitive to acute serotonin release, and [11C]DASB as not validated as a release assay .
Challenge displacement differs in kind: a change in binding during a stimulus within one session (amphetamine, sustained pain), read as release, on a clock of minutes. A baseline contrast between cycle phases is not a release assay. Enzyme tracers split again: [11C]5-HTP and [18F]FMT are trapped by synthesis, [11C]PMP reports a hydrolysis rate, and [11C]harmine VT reflects reversible enzyme binding. FDG reports glucose uptake over one uptake period, sensitive to task, fasting, delivery and normalization. Amyloid and tau tracers integrate years to decades of pathology.

Figure 4.2 sets the classes against the endocrine exposures the map’s studies actually used. A measurement taken in one session can sit days or years away from the exposure it is meant to reflect, and the design has to say why that interval suits the biology.
span one measurement integrates (schematic)exposure timing used by studies in the map
Challenge displacementΔBP during a stimulus
- 1Smith 2006: pain held 20–40 min after injection.
- 2Smith 2006: 7–9 days of estradiol before scanning.
Receptor availabilityBPND or VT at the scan
- 3Kranz 2014: at least 8 weeks, randomized.
- 4Kugaya 2003: 10 weeks of estradiol.
Transporter availabilitySERT or DAT binding at the scan
- 5Frokjaer 2015: ~16 days after GnRH agonist, randomized.
- 6Gardiner 2004: 4 weeks CEE, then 2 with a progestin.
- 7Jovanovic 2015: 3 months of estradiol.
- 8Kranz 2015: 4 weeks and 4 months.
Enzyme trapping or binding5-HTP, FMT, PMP; harmine VT
- 9Sacher 2010: 4–6 days postpartum.
- 10Kranz 2021: 4 months.
- 11Handschuh 2024: median ~4.5 months.
Glucose useFDG over one uptake period
- 12Ottowitz 2008a: 24 h and 72 h of infusion.
- 13Rasgon 2014a: 2 years, randomized.
- 14Mosconi 2018: at least 2 years.
Amyloid and tau accumulationSUVR: years of pathology
- 15Kantarci 2016: 4 years of therapy, PET ~3 years later.
- 16Kantarci 2026: PET ~10 years after the trial.
- 17Kantarci 2025: decades after oophorectomy.
A worked example, explicitly hypothetical. Suppose estradiol leaves receptor number unchanged but lowers nondisplaceable uptake in the reference region alone by 5%. The target-to-reference ratio rises by about 5% (1 ÷ 0.95 ≈ 1.053), and since a reference-tissue BPND is that ratio minus one, a region reading 1.0 would read about 1.1. Arterial input with a measured free fraction would expose the artefact; two reference-based summaries of the same scans would agree on it.
Serotonin: the densest band and the best design
Serotonin holds 24 rows and the map’s strongest causal design, but its receptor, transporter, synthesis and enzyme tracers are four different measurements.
The band has 13 receptor rows (5-HT1A, 5-HT2A, 5-HT4), five transporter rows, one synthesis row and five monoamine oxidase A rows, and touches every endocrine context in the map.
The strongest design is Frokjaer 2015: 63 healthy women randomized to a GnRH agonist or placebo, 60 completing, with neocortical SERT binding measured at baseline and about 16 days later . There was no simple global effect, but depressive responses tracked SERT change. Randomization makes the contrast credible without changing what [11C]DASB binding is, and a GnRH agonist suppresses the whole axis rather than isolating estradiol. A controlled-access record linked to this study (PN000018) declares 63 participants; no access has been requested.
Sacher 2023 is the most detailed cycle study: 118 scans in 30 women with premenstrual dysphoric disorder (PMDD) and 29 controls. Midbrain SERT BPND rose about 18% premenstrually in PMDD against a roughly 10% fall in controls : a regional, symptom-linked change in availability, not a healthy-population hormone effect.
The receptor rows are smaller. Kranz 2014 randomized 30 postmenopausal women to estradiol with progesterone, estradiol alone or placebo for at least eight weeks and found no significant arm-by-time change in 5-HT1A BPND ; ten per arm leaves wide uncertainty. Moses 2000 and Moses-Kolko 2003 analyse the same five women, Kugaya 2003 (ten women, ten weeks of estradiol) had no control arm, and the nominal difference in Compton 2008 (1.17 versus 1.11, p = 0.02) did not survive correction. Kauffmann 2025 pooled two tracers: null overall, with lower binding in pill users in the agonist [11C]Cimbi-36 subgroup .
Larsen 2020 found roughly 9 to 12% lower global 5-HT4 binding in 16 oral-contraceptive users among 53 women ; a randomized pill-versus-placebo 5-HT4 study (NCT05212389) shows status unknown and no results. Among the [11C]harmine rows, Sacher 2010 found higher MAO-A binding 4 to 6 days postpartum, Rekkas 2014 higher binding in a perimenopausal-age group (age and stage not separated), and in gender-affirming treatment testosterone lowered binding (Kranz 2021) while Handschuh 2024 detected no change after about four and a half months.
Dopamine: availability, release and synthesis are three measurements
Eight dopamine rows ask three questions, and the clearest positive concerns synthesis capacity in contraceptive users.
Within the cycle, Nordstrom 1998 had only four women with a true cross-phase contrast and no difference beyond test–retest variability ; Petersen 2021 (16 women, [18F]fallypride) and Best 2005 ([123I]β-CIT) were also null. Taylor 2023 found higher synthesis capacity ([18F]FMT) in 15 contraceptive users than in 21 naturally cycling women, without differences in baseline D2/3 availability or stimulated release , and the exploratory amphetamine analyses of Smith 2019 agreed on release. Synthesis is a trapping estimate, BPND is availability, and amphetamine displacement is the release assay.
Gardiner 2004 is the one administration row: 13 postmenopausal women received conjugated equine estrogens (CEE) for four weeks, then two more with medroxyprogesterone, and anterior-putamen transporter uptake rose . With no placebo and a progestin added mid-study, estradiol is not isolated. Moses-Kolko 2012 (postpartum and depression) and Pohjalainen 1998 (a secondary eight-woman menopause contrast) complete the band.
Opioid: baseline availability and a pain challenge are different endpoints
One estradiol study measured two estimands in the same women, and they should not be merged.
Smith 1998 found no robust phase contrast in ten cycling women, although carfentanil binding related to luteinizing-hormone pulsatility.
Smith 2006 is the instructive example . Eight of ten recruited women were analysed, each scanned twice in the early follicular phase (days 2 to 9) and twice after 7 to 9 days of transdermal estradiol, which raised mean estradiol from 38 to 262 pg/ml. Each pair combined a control infusion with sustained jaw-muscle pain held 20 to 40 minutes after injection; eight men were scanned for comparison, against an occipital reference.
High estradiol was associated with higher baseline μ-opioid availability in some regions and with greater pain-evoked displacement (ΔBP), read as endogenous opioid release; the low-estradiol state showed reduced opioid activity in thalamus, nucleus accumbens and amygdala, with hyperalgesia . Baseline BPND is availability at rest; ΔBP is displacement during pain, and can also reflect trafficking or affinity. The estradiol scans always came second, so order cannot be excluded.
Cholinergic: four small windows on four targets
Four rows, four targets, and no randomized treatment.
Cosgrove 2007 found no phase effect on β2* nicotinic availability in nine non-smokers. Smith 2001 (16 hormone-therapy users, 12 non-users) saw no group difference in vesicular acetylcholine transporter binding, though longer therapy correlated with higher cortical binding; Norbury 2007 reported higher muscarinic binding in 11 estrogen users than in 11 never-users; Smith 2011a measured an acetylcholinesterase hydrolysis rate, not binding, in 50 women grouped by formulation . All three compare treatment chosen years earlier, so selection, formulation and duration are entangled.
Glucose use: downstream of nearly everything
FDG supplies 17 rows and some of the best designs, but glucose uptake also integrates perfusion, task, fasting and normalization.
The fastest clock belongs to Ottowitz 2008a: in eleven women receiving graded estradiol infusion, hypothalamic uptake fell at 24 hours with luteinizing-hormone suppression and pituitary uptake rose at 72 hours with the surge ; Ottowitz 2008b and Ottowitz 2008c reanalyse the same programme. Rasgon 2014a randomized women at elevated dementia risk to continue or stop long-term therapy for two years, and continuing relatively preserved frontal and parietal metabolism . That randomizes continuation, not initiation or formulation; Rasgon 2014b and Silverman 2011 analyse the same trial.
Mosconi 2017, Mosconi 2018 and the FDG arm of Mosconi 2021 (161 women) report lower metabolism in Alzheimer-vulnerable regions across the transition , but age and stage overlap only partly, and participant overlap between the papers is unresolved. Cycle rows (Reiman 1996, Tu 2009, Rapkin 2011) and naturalistic therapy studies (Rasgon 2001, Rasgon 2005, Kenna 2009, Eberling 2000, Eberling 2004) complete the band.
Amyloid and tau run on decades
Eleven pathology rows include two randomized follow-ups of one trial, read at different delays and with different results.
KEEPS randomized recently postmenopausal women to oral CEE, transdermal estradiol or placebo for four years. In 68 women scanned about three years after treatment, transdermal estradiol was associated with lower PiB SUVR than placebo (adjusted OR 0.31, 95% CI 0.11 to 0.83) and oral CEE was not (Kantarci 2016) . About ten years after the trial, 244 amyloid scans showed no significant difference among randomized groups (Kantarci 2026) . Differently timed and powered rather than contradictory, neither is an acute hormone-sensitive signal .
The observational rows are larger and harder to attribute: therapy timing with tau in the presence of amyloid (Coughlan 2023), faster tau accumulation after prior therapy in women over 70 (Coughlan 2025), lower tau biomarkers with therapy (Wang 2024), few PET associations (Lee 2024), and higher amyloid and tau after oophorectomy before age 46 (Kantarci 2025). Mosconi 2021 found no menopausal-group amyloid difference, Buckley 2022 found menopause moderating sex differences in tau, and Zeydan 2021 is a post hoc sleep analysis within KEEPS. Exposures, timing, ages and selection differ; no pooled effect would be meaningful.
Small nulls, postpartum and mixed regimens
Three habits would distort this map: reading small nulls as equivalence, treating postpartum as a model of menopause, and crediting estradiol with a mixed regimen’s effects.
Eight downstream cycle-phase rows found no clear phase effect (Nordstrom 1998, Smith 1998, Best 2005, Jovanovic 2006, both Jovanovic 2009 arms, Cosgrove 2007, Petersen 2021), each with four to sixteen women. They cannot show that phase leaves these targets unchanged, but they keep the chapter from resting only on positives.
Null resultA non-significant contrast in four to sixteen women is absence of evidence at that precision; at most it bounds very large effects.
Postpartum is not healthy menopause. All four postpartum rows are cross-sectional, three involve depression or postpartum crying, and the best-timed samples days 4 to 6, when hormones, lactation, sleep and mood change together. Moses-Kolko 2008 reported roughly 20 to 28% lower 5-HT1A binding in postpartum depression, a clinical contrast without a pre-pregnancy baseline. A 2009 conference abstract (Sacher 2009) adds eight women at weeks 2 to 8 with reported normalization of MAO-A binding ; its overlap with the published cohort is unresolved.
| Exposure in the map | What changes besides estradiol | Rows |
|---|---|---|
| Combined oral contraceptive | Synthetic estrogen plus progestin; ovulation suppressed | Frokjaer 2009, Larsen 2020, Taylor 2023 |
| GnRH agonist | Whole reproductive axis suppressed | Frokjaer 2015 |
| Estradiol, then progesterone | Sequence and progesterone; no parallel control | Moses 2000 |
| CEE, then CEE with a progestin | Mixed conjugated estrogens, then a progestin | Gardiner 2004 |
| Estrogen-only versus combined therapy | Formulation, duration, indication, all chosen | Smith 2001, Smith 2011a |
| Gender-affirming estrogen | Given with an antiandrogen | Kranz 2015 |
| Oral CEE versus transdermal estradiol | Molecule and route differ | Kantarci 2016 |
A mixed regimen can be the right clinical question and the wrong mechanistic one: estrogen in the rationale does not make estradiol the isolated cause.
The inhibitory perspective
Inhibitory signalling keeps the synaptic story from collapsing into AMPA alone, but its four common measurements are not one quantity.
No map row images GABA. Michopoulos 2013 used [18F]flumazenil PET in ovariectomized female rhesus monkeys, all receiving estradiol, to test whether social subordination alters GABA-A receptor BPND . Subordinate females had higher prefrontal binding than dominant ones, and three days of a CRH receptor antagonist (astressin B), compared with saline, removed the difference.
Estradiol was present in both conditions. The study varies stress signalling against a fixed estradiol background and says nothing about estradiol alone. The reading covers the abstract and indexed methods, not the full text.

Flumazenil binding is benzodiazepine-site availability: not GABA concentration, not inhibitory current, and not neurosteroid occupancy at other receptor sites. MRS GABA+ is a spectroscopy signal that includes co-edited macromolecules. The SAGE protocol (Jimenez-Balado 2026) plans spectroscopy, task fMRI, hormones and reproductive history in 300 adults aged 50 to 79, two-thirds women ; it has no outcomes yet and no PET. A flumazenil PET and TMS study notes that menstrual cycles were not accounted for (Steinholtz 2023). The question these motivate is whether an endocrine contrast moves receptor availability, GABA+ and excitability together or apart .
AMPA: a registered direction with a metabolite-mediated signal
Menopause-related AMPA imaging is a real, registered study, built on a tracer whose image is attributed mainly to a labelled metabolite and validated so far in reused and male cohorts.
The WISH record (jRCTs031250654) describes a single-arm, open-label diagnostic study of 60 women aged 40 to 59 , relating the Menopause Rating Scale to white-matter-referenced [11C]K-2 SUVR, with hormones, menopausal status and time since the last menstruation as secondary endpoints. It is interventional only because it gives an unapproved probe. Hormone therapy and ovarian or uterine removal are excluded, and the Japanese list also excludes recent GnRH-analogue use, an item missing from the English list, so WISH cannot address surgical menopause or treatment response. Enrolment began on 9 February 2026 with a planned end in March 2030, and the study site reported 18 completed PET scans on 17 September 2026: a milestone, not an analysed sample.

Arisawa 2021 attributes the image mainly to labelled K-2OH rather than unchanged K-2 . In an in-vitro barrier model, permeability was 182.89 ± 3.28 ×10⁻⁶ cm/s for K-2 and 5.26 ± 0.09 ×10⁻⁶ cm/s for K-2OH, which showed no substrate behaviour in three efflux assays ; the rat work used a pharmacological 10 mg/kg dose and four male rats.
A brain-active metabolite does not invalidate a tracer; it obliges a specification of which labelled species binds, how it arrives and how much it contributes. Nothing here shows those relationships hold across endocrine states .
1Registered direction
registry record
WISHDiagnostic K-2 PET in 60 women aged 40 to 59.
No HRT or surgical menopause; no results.
2Tracer chemistry
full text
K-2 → K-2OHArisawa 2021: signal attributed to the metabolite; slow barrier crossing in vitro.
In vitro and rat only.
3Validation cohorts
citation chain only
Original validationMiyazaki 2020: tissue and kinetics.
same patients · 5 of 8
full text
Epilepsy follow-upMiyazaki 2022: regional colocalization.
registry record
RepeatabilityTen men aged 20 to 39.
Plans only.
4Missing pieces
- The original study, read afresh
- WISH statistical plan
- Repeatability numbers, in midlife women
- Metabolite and reference behaviour across endocrine states
The validation chain has a reused link: Miyazaki 2022 reanalyses five of the eight patients of the original study , which itself (Miyazaki 2020) was not freshly read here . The repeatability registry (jRCTs031250631) plans two scans in ten men aged 20 to 39 and reports no number . Briz 2015 adds caution about direction: in male-rat hippocampal slices, G-1 or estradiol reduced membrane GluA1 in CA3–dentate but not CA1 at one hour, and G-1 alone did not change field responses but primed later long-term depression . Surface protein, total protein and plasticity moved separately; the sign of a human K-2 effect is not predicted .
SV2A: an emerging direction, signalled by programmes
Synaptic-density imaging in menopause is visible here only as a programme title and a grant announcement: a direction to watch, not a result.
The 15 May 2026 SLAM-DUNC programme (SLAM-DUNC 2026) lists Melissa Walsh’s presentation “Mapping Menopause-Related Synaptic Vulnerability: A Pilot SV2A-PET Study” . A 20 April 2026 announcement describes a $4.2 million NIMH grant for SV2A PET in premenopausal and postmenopausal women with and without depression (Esterlis and Pietrzak 2026) . Neither supplies results, data or recruitment status; they sit beside AMPA so that unpublished is not misread as unstudied.
GPER: a name that needs a qualifier
An effect called GPER-mediated is usually G-1-responsive or GPER-implicated; whether estradiol binds GPER directly is contested.
Liu 2024 reported structural, binding and signalling evidence that GPR30 (GPER) is not a direct estrogen receptor in the tested systems . That does not settle every GPER mechanism, and pathway or agonist evidence does not prove direct estradiol binding either; engineered-cell binding work continues (Ding 2022).
The paper’s 2025 author correction (Liu 2025) states that the G-1 structure shown in Fig. 1a and Supplementary Fig. S3b was incorrect, that the correct G-1 was used experimentally, and that results and conclusions are unaffected . It is not a retraction; figures should use the corrected structure. A separate 2024 correction fixed names in one reference. So when Briz 2015 calls its plasticity GPER1-dependent, read GPER-implicated through G-1 pharmacology, not proof that estradiol binds GPER .
| Branch | Source | What it is | What it shows | Cannot show | Depth |
|---|---|---|---|---|---|
| Inhibitory | Michopoulos 2013 | Primate flumazenil PET; CRH antagonist or saline | Status difference removed | Any estradiol effect | |
| Inhibitory | Jimenez-Balado 2026 | Human MRS protocol | Planned endocrine phenotyping | Outcomes; binding | |
| Inhibitory | Steinholtz 2023 | Flumazenil PET with TMS | Cycle phase unaccounted | Hormone effects | |
| AMPA | jRCTs031250654 | WISH registry record | A registered direction | Results | |
| AMPA | Arisawa 2021 | Tracer mechanism | K-2OH model | Endocrine invariance | |
| AMPA | Miyazaki 2020 | Original validation | Cited only | Anything read here | |
| AMPA | Miyazaki 2022 | Epilepsy reanalysis | Colocalization, 5 reused patients | Independent validation | |
| AMPA | jRCTs031250631 | Repeatability registry | Planned CV and ICC | Any number | |
| AMPA | Ichijo 2025 | F-18 K-40, first in human | A chemistry lead | Menopause evidence | |
| AMPA | Briz 2015 | Male rat slices | Regional GluA1 trafficking | A PET effect’s sign | |
| SV2A | SLAM-DUNC 2026 | Programme title | A pilot presentation | Results | |
| SV2A | Esterlis and Pietrzak 2026 | Grant announcement | A funded study | Results | |
| GPER | Liu 2024 | Structural and binding study | No direct binding, tested systems | All GPER biology | |
| GPER | Liu 2025 | Author correction | G-1 depiction fixed | A retraction | |
| GPER | Ding 2022 | Engineered-cell binding | Ligand binding–function link | Brain PET |
What would discriminate
The decisive downstream study pairs a well-defined endocrine contrast with a tracer whose estimand, clock and quantification have been checked in the population studied.
Four ingredients, none exotic: a contrast that identifies something (randomized or within-person exogenous, hormones measured at the scan); a tracer whose sensitivity to endogenous competition is known and whose window fits the question; metabolite-corrected input or a tested reference, with repeatability in comparable women; and an orthogonal assay of the same biology.
HypothesisTwo desk-first tests need no new scanning. If access were granted, the controlled GnRH-agonist SERT data could ask whether availability tracks measured hormone change rather than group assignment; and WISH could be compared field by field with receptor, SV2A and metabolic studies on staging, exclusions, timing and reference assumptions.
What this chapter does not show
- A validated multimodal panel of estrogen response.
- Uniform up- or down-regulation of synaptic or monoamine targets by estradiol.
- Independent replication wherever publications share a tracer, cohort or trial.
- That small cycle-phase nulls establish equivalence.
- Any SV2A or menopause AMPA outcome.
- Whether GPER is a direct estradiol receptor in every system.
05
Neuroimmune imaging · TSPO, MAO-B, P2X7, CSF1R, COX-1, COX-2
Neuroimmune imaging is several different measurements
Estrogen loss is often described as inflaming the brain, and several PET tracers are routinely called markers of neuroinflammation. Both phrases hide the question that matters. A TSPO signal can rise because there are more cells, because each cell carries more of the protein, or because a different cell type is involved, and a cell can change state without moving it at all. This chapter separates those claims, sets five other targets beside TSPO as different questions rather than confirmations, and asks which cell-level change an endocrine study should look for before a scanner is booked.
ObservedIn 43 pooled healthy adults, hypothalamic TSPO binding rose with age among the 19 women, none with reproductive data; ovariectomized mice show delayed hypothalamic inflammatory-pathway changes in transcripts.
AttributionWeak. Age, not endocrine stage, was measured, and a TSPO signal cannot say whether cell number, protein per cell or a different cell type changed.
DiscriminatorA defined endocrine contrast with cell-resolved tissue measures (cell counts, target protein per cell, state markers) taken at the time point that would be imaged.
Next questionWhich cell quantity changes, when, and in what context, after ovarian hormone loss? Settle that in tissue, then choose the tracer that can see it.
One word, four claims
“Neuroinflammation” bundles at least four separable claims: how many immune cells a tissue holds, what state they are in, what their mitochondria are doing, and what disease surrounds them. A PET tracer can speak to some of these. None speaks to all of them at once.
When a paper says a tracer signal “reflects microglial activation”, it compresses several statements that each need their own evidence. Cell abundance is how many microglia, astrocytes or perivascular macrophages occupy a volume of tissue. Cell state is what those cells are doing (surveying, engulfing, signalling), read from morphology, transcripts and protein markers. Mitochondrial signalling matters because two of the best-known targets, TSPO and MAO-B, are mitochondrial proteins whose amount or modification can follow a cell's metabolic and steroid-handling business rather than its immune role. Disease context matters because a tracer can have a validated relationship with pathology in progressive supranuclear palsy or HIV that tells us nothing about a healthy brain passing through menopause.
These claims need not conflict, and the most informative TSPO literature shows exactly that: a tracer can be a faithful index of how many microglia a region contains while saying very little about whether each of those cells is “activated” . Holding the four apart is not pedantry. It decides which experiment can test an estrogen hypothesis, and which result would merely be compatible with one.
What a TSPO signal is a sum of
TSPO is a mitochondrial protein carried by microglia, astrocytes and the cells of vessel walls. In human tissue its PET signal tracks how many microglia there are, not how activated each one is.
Wijesinghe 2025 is the cleanest test available. Eight people with progressive supranuclear palsy, a tauopathy, had PK11195 PET in life and donated their brains. Double-labelling of the same donors' tissue found TSPO in microglia, astrocytes and endothelial cells . Regional binding potential before death correlated with the post-mortem burden of CD68-positive phagocytic microglia, and microglial TSPO was higher in the patients than in three control donors. TSPO per microglial cell, however, did not differ significantly . The rise came from more microglia, each carrying a similar amount. The authors conclude that disease-related PK11195 changes in tauopathy are largely driven by microglia . Two limits travel with that conclusion: scans preceded death by 6 to 49 months, a long interval for a moving process, and the study was not powered to confirm small age or sex effects.
Nutma 2023 reaches a compatible conclusion from the other direction. In mouse disease models, activated microglia increased TSPO expression; in a non-human primate disease model and in common human neurodegenerative and neuroinflammatory diseases they did not . The authors trace the difference to divergence in the TSPO gene's promoter, consistent with an activation-induced increase confined to a subset of rodent species, and argue that human TSPO-PET signals reflect the density of inflammatory cells rather than their activation state . Read here at abstract level, it is a species caution. It is not a verdict that human TSPO PET carries no inflammatory information.
The apparent contradiction, a human validation that “worked” set against a paper arguing that TSPO is not an activation marker, dissolves once the claims are separated. Both say that in human tissue TSPO PET follows cell number. Neither says it reports activation per cell. Applied to endocrinology, a TSPO increase after ovarian hormone loss would be a statement about how many TSPO-carrying cells are present, and possibly which ones, not about how inflamed each of them is .
A worked example, explicitly hypotheticalSuppose microglia carry 40% of a region's specific TSPO signal and astrocytes and vessel cells the other 60%. If microglia increase in number by 30% and nothing else changes, the regional signal rises by 12% (0.4 × 30%). A 30% rise in TSPO per microglial cell, with no new cells, produces the same 12%. Add a 20% fall in astrocytic TSPO to that microglial increase and the region does not change at all (0.4 × 30% = 0.6 × 20%). This is arithmetic, not data: the cellular split of TSPO binding in a healthy midlife brain is unknown, which is exactly why the split has to be measured rather than assumed.
Demography is part of this measurement, not background to it. Tuisku 2019 pooled PBR28 PET from 140 healthy adults (72 men, 68 women) scanned at three centres, with the tracer's genotype-dependent binding class entered in the model. Women had higher distribution volumes in every region examined, body-mass index was negatively related to binding everywhere, and age correlated positively with binding in men but not in women . Sex, body mass and age are all entangled with menopause, so a cross-sectional endocrine comparison inherits all three. The absent age effect in women does not refute the hypothalamic finding below, because tracer, regions and cohort differ. It does show how unstable an age-by-sex pattern can be from one sample to the next.
Deep dive: why reference regions are especially fragile for neuroimmune tracers
A reference region is supposed to contain no specific target. For TSPO there is no such tissue, because the protein is present throughout the brain; PK11195 studies therefore build a reference curve by supervised clustering of voxels with a “normal” kinetic shape, as Butler 2022 did . For the P2X7 tracer, no reference region could be identified at all, so quantification needs arterial blood. The MAO-B tracer SMBT-1 uses cerebellar grey matter as a pseudo-reference while its developers acknowledge that the tissue contains non-negligible MAO-B, and the cerebellum is one of the places where estradiol raised MAO-B activity in ovariectomized rats.
The COX-2 tracer shows the trade-off most clearly. Reference-tissue methods cut its retest variability by up to three-quarters and halved between-subject variation in healthy people, which shrinks the sample a study needs; the full text also reports a lower intraclass correlation with these methods . Whether a reference behaves the same way across a whole-brain endocrine transition is untested for every tracer in this chapter . If the denominator shares the change, a ratio can cancel a real effect, or manufacture one.
The endocrine bridges are indirect
Three studies connect TSPO to ovarian hormones, and each makes a different kind of claim: an age association in women, a delayed transcriptional response to ovariectomy in mice, and a mitochondrial signalling pathway in rats. None is an endocrine-annotated human TSPO PET contrast.
Butler 2022 comes closest to the human question. Forty-three healthy adults (19 women, aged 23 to 78), pooled from the control groups of several clinical studies, had dynamic PK11195 PET . Across everyone, binding correlated with age in the thalamus but not the hypothalamus. Analysed by sex, only the women showed an age-correlated hypothalamic signal, and the authors compared the two correlations directly rather than leaning on significance in one subgroup. They link this to menopause, the sex difference in reproductive ageing . That link is the gap. Reproductive stage, reproductive history and hormone exposure were not available, so age stands in for an endocrine variable nobody measured . The authors acknowledge that TSPO is expressed by several cell types and that the hypothalamus is small relative to PET resolution. In this chapter's terms, the title's “microglial activation” is a reading of the signal rather than a measured quantity.
43 / 19
pooled healthy controls / women among them, aged 23 to 78, with no reproductive-stage data
14 d · 4 mo
after ovariectomy: the two mouse time points, with the larger changes at four months
31
female human hypothalami compared by age, without menopausal or hormone annotation
Bloom 2026 supplies the time axis. Mice were examined 14 days and 4 months after ovariectomy, with bulk RNA sequencing of the posterior hypothalamus and preoptic area. Luteinizing hormone rose and then declined, and core temperature peaked early and then normalized. Inflammatory pathways, glial markers and gene networks of the KNDy neurons that drive reproductive hormone release changed with time, most strongly at four months in the posterior hypothalamus, and immunofluorescence showed heightened astrocytic reactivity in the arcuate nucleus . Age-related transcript patterns in 31 female human hypothalami correlated with the mouse model, particularly at pathway level.
Three limits govern reuse. The four-month group had no age-matched intact comparator, so ovariectomy and ageing are partly confounded. The human tissue carried no menopausal stage, hormone therapy or hormone measurements. And individual inflammation markers, including a discussed Tspo trend, did not survive correction for multiple testing . A pathway is not a target gene, and a transcript is not a binding site a tracer could find.
Wang 2021 points somewhere else entirely. In ovariectomized rats, an agonist of the G-protein-coupled estrogen receptor given into the cerebral ventricles activated protein kinase A, increased TSPO phosphorylation and eased depression- and anxiety-like behaviour, and a kinase inhibitor partly blocked the effect . Read at abstract level, it suggests estrogen signalling can modify TSPO through mitochondrial pathways that have nothing to do with how many immune cells are present. Phosphorylation is not binding-site abundance, and injection into the ventricles says nothing about exposure after systemic dosing. It is a useful counterweight to the default chain from estrogen loss to inflammation to a higher TSPO signal, a chain no study here has demonstrated end to end.
The direction is not establishedThe estrogen–TSPO evidence in this chapter is an age association without endocrine data, a delayed transcript trend that did not survive correction, and a phosphorylation effect after central injection. Whether ovarian hormone loss raises, lowers or leaves TSPO PET unchanged in women is an open question, not a known effect awaiting confirmation.
Five other targets, five other questions
MAO-B, P2X7, CSF1R, COX-1 and COX-2 are not interchangeable confirmations of neuroinflammation. Each is a different molecule with a different cellular home, a different level of human validation, and a different, mostly indirect, link to ovarian hormones.
The matrix below sets them beside TSPO. Its most important column is the fourth. For the targets other than TSPO, the endocrine evidence comes from animal tissue, cell culture or injury models, and none of the PET studies selected here tested a human hormone manipulation . That is the outcome of a bounded search, not proof that no such study exists. Several of the readings behind the matrix are at abstract level, and the right-hand column says so.
Target
What it is
Shown so far
Endocrine bridge
Missing before an endocrine study
How it was read
TSPOPK11195, PBR28
Translocator protein of the outer mitochondrial membrane; found in microglia, astrocytes and endothelial cells.
Human PET in health and disease; in PSP, post-mortem validation that tracks microglial number.
Age-linked hypothalamic binding in women without endocrine data; delayed post-ovariectomy pathway changes in mice; GPER-driven TSPO phosphorylation in rats.
An endocrine-annotated human contrast; which cells change; whether rodent regulation transfers.
Full text for the human, pathology and mouse studies; abstract for the rest
MAO-BSMBT-1
Monoamine oxidase B, a mitochondrial enzyme; widespread, predominantly astrocytic.
Arterial-input kinetics in 14 older adults; cerebellar grey matter as pseudo-reference.
Estradiol raised MAO-B activity in ovariectomized rat brainstem and cerebellum; a later rat study saw no brain change at three weeks.
Reference behaviour under endocrine change; astrocyte number versus enzyme per cell.
Abstracts and indexed passages
P2X7JNJ-64413739
ATP-gated ion channel; described as mainly microglial, also neuronal in injured mouse tissue.
Kinetics, test–retest and antagonist occupancy in healthy men; no usable reference region.
After nerve injury in ovariectomized mice, estradiol shifted P2X7 from neurons to microglia with total protein unchanged; amplified in a rat dry-eye model.
Any female human data; an uninjured endocrine contrast; binding is not channel opening.
Abstracts and the trial registry
CSF1RCPPC
Colony-stimulating factor 1 receptor; microglia and CNS macrophages, little elsewhere.
An HIV pilot in 31 people, overall difference not significant; no baseline specific binding in mouse or monkey.
Genotype-dependent cortical Csf1r RNA after early ovariectomy in amyloid-model mice.
Demonstrated specific binding; efflux; protein rather than RNA; cell number versus per-cell amount.
Abstracts and selected sections
COX-1not imaged here
Cyclooxygenase-1, a prostaglandin-making enzyme.
No COX-1 imaging in the studies read; a COX-1 inhibitor appears only as a blocking control.
In ovariectomized rats, COX-1 near GnRH neurons sat entirely in ramified microglia, with or without steroids.
Imaging at all; evidence that prostaglandin signalling changes with hormones.
Abstract and introduction
COX-2MC1
Cyclooxygenase-2; sparse in healthy brain, preferentially neuronal, inducible.
27 healthy people with blockade and test–retest, data open; negligible binding to rodent COX-2.
Estrogens damped induced COX-2 release from cultured rat microglia.
A hormone contrast in people, or in a model the tracer can actually see.
Full text for the imaging study (supplement unread); abstract for the culture study
MAO-B: an astrocytic enzyme whose reference may itself respond
SMBT-1 is a fluorine-18 tracer for MAO-B. Lopresti 2024 modelled it in 14 older adults (8 controls, 5 with mild cognitive impairment, 1 with Alzheimer's disease) with arterial input. A two-tissue model with the K1/k2 ratio fixed to a whole-brain value described the kinetics best; cerebellar grey matter had the lowest distribution volume and was proposed as a pseudo-reference, and a 70–90 minute ratio to it tracked the modelled value with about 10% bias . The authors describe brain MAO-B as widespread and predominantly astrocytic, and associate reactive astrogliosis with its overexpression .
That pseudo-reference is where the endocrine question bites. In ovariectomized rats, acute or month-long estradiol increased MAO-B activity in the brainstem areas sampled and in the cerebellum (Chevillard 1981) . If anything similar happened in women, an endocrine contrast could move the denominator of an SMBT-1 ratio, the same structure chapter 1 found under the FES menopause finding . A later study found no brain MAO-B change after three weeks of high-dose estradiol in cortex, amygdala or hypothalamus, while MAO-B fell in liver, kidney and uterus (Holschneider 1998) . Different regions, doses and durations mean the two are not a failed replication. Together they say that peripheral and brain responses cannot stand in for each other, and that the cerebellum's stability is a hypothesis to test, not a default. MAO-A imaging across perimenopause and postpartum belongs to chapter 4's downstream map. It is a different enzyme and should not be folded into a claim about astrocytes.
P2X7: a bulk measure can hide opposite changes
P2X7 is an ATP-gated ion channel that its PET developers describe as predominantly microglial in the central nervous system (Koole 2019) . Their tracer, [18F]JNJ-64413739, was qualified in healthy men: 3 for dosimetry, 5 for arterial kinetic modelling, 4 of those rescanned 26 to 97 days apart, and 8 in an occupancy study with a P2X7 antagonist. These phases overlap, and the trial registry lists 16 participants in total, so the counts must not be added. Distribution volumes were about 3 and fairly uniform across regions, test–retest variability was about 11%, occupancy approached saturation above single doses of 50 mg, and no reference region could be identified. It is a working measurement and drug-engagement route, established in men only. That is an annotation gap for an endocrine study, not evidence that the tracer behaves differently in women.
The endocrine evidence is cellular, and it carries a warning about bulk measures. In ovariectomized mice with a cut hypoglossal nerve, a single estradiol injection enhanced two opposite changes on the injured side: P2X7 immunostaining in neurons fell further, while P2X7 in microglia rose further (Barabasi 2016) . Total P2X7 protein measured by Western blot did not differ between sides in either group, and estradiol did not change the area occupied by microglia. A tracer that sums P2X7 across a voxel could report nothing in a tissue where the receptor had moved substantially between cell types .
In a rat model of dry eye, estradiol-treated females showed larger increases in trigeminal brainstem P2X7, in the myeloid marker Iba1 and in the inflammasome component NLRP3 than untreated females, and a P2X7 antagonist injected into the brainstem reduced the pain-related response (Bereiter 2022). Both studies are injury or disease models, and a locally injected antagonist says nothing about systemic exposure. Neither tells us what P2X7 does in an uninjured brain losing ovarian hormones.
CSF1R: preferential expression is not tracer specificity
CSF1R is expressed on microglia and central nervous system macrophages, with little expression on other cell types, which is why it was proposed as a more cell-specific alternative to TSPO (Rubin 2023). In the first clinical pilot, 16 virally suppressed people with HIV and 15 uninfected participants had [11C]CPPC PET with metabolite-corrected arterial input. After adjustment for age and sex, regional binding did not differ significantly between groups (p = 0.13); the effect size was moderate, and the authors read the study as underpowered . Nothing in the design involved ovarian state.
Specificity comes before any of that. A development study comparing CPPC with a higher-affinity fluorinated analogue found no CSF1R-specific binding at baseline for either radioligand in mouse or monkey, and found that both behaved as substrates of brain efflux transporters in vivo (Altomonte 2023) . Baseline specific binding in healthy animals may simply be too small to detect, and inflamed tissue may behave differently. Until specific binding is shown, a CPPC signal cannot be assumed to measure CSF1R, let alone microglia . The endocrine link is a mouse transcript: after early ovariectomy, with or without estradiol replacement, cortical Csf1r RNA responded differently in amyloid-bearing and wild-type mice (Saha 2024) . Bulk RNA cannot separate more microglia from more Csf1r per microglial cell, and the authors state that the model does not represent a menopausal brain.
COX-1 and COX-2: two enzymes, two hypotheses
Cyclooxygenases make prostaglandins, and the two isoforms are not two names for one target. In ovariectomized rats, COX-1 around preoptic GnRH neurons sat entirely within CD11b-positive cells with the small bodies and highly branched processes of ramified microglia, whether or not the animals received steroid replacement (Fujioka 2013) . The localization suggests a route from microglia to the neurons that drive the reproductive axis. Its constancy across steroid conditions makes it a constraint on direction, not a hormone-sensitive imaging target.
COX-2 differs in nearly every respect. It is sparse in healthy brain, preferentially neuronal, and can be markedly upregulated by excitatory input and inflammatory stimuli (Yan 2025) . In cultured rat microglia exposed to bacterial lipopolysaccharide, estradiol and both ERα- and ERβ-selective agonists attenuated the release of COX-2 and inflammatory cytokines (Smith 2011b) . That is a mechanism in a dish, not ovarian depletion and not imaging, and it does not make COX-2 a microglial marker.
The COX-2 imaging, by contrast, is unusually well characterised. Yan 2025 gave [11C]MC1 to 27 healthy people with arterial sampling: 10 had baseline and celecoxib-blocked scans, and 17 had test–retest scans. Celecoxib reduced neocortical binding by about 25% with little effect in subcortical regions or cerebellum, a pattern that followed COX-2 messenger RNA. Test–retest reliability was moderate (intraclass correlation 0.65) with about 20% retest variability . The animal work is where an endocrine plan would stumble. In rats injected with lipopolysaccharide the tracer showed negligible specific binding despite strong COX-2 upregulation, because its affinity for rodent COX-2 is low; specificity was shown instead in mice carrying the human COX-2 gene, where 70–90% of brain uptake was blocked . That transgene is constitutively driven, so it establishes binding without reproducing normal inflammatory regulation .
A working human tracer does not make a rodent experiment informative
Species can decide an experiment before the hormone does. The standard ovariectomized-rat design is uninformative for a tracer that barely binds the rat target, and misleading for a target that rodents regulate differently.
Two of this chapter's clearest findings are species findings. Rodent microglia raise TSPO when activated and human microglia do not (Nutma 2023), and a COX-2 tracer able to measure sparse human COX-2 barely sees rodent COX-2 at all (Yan 2025). In the CSF1R development work, the analogue entered monkey brain but not mouse brain (Altomonte 2023). Together they give one practical rule: before an endocrine imaging experiment is designed in an animal, the tracer's affinity for that species' target and the target's regulation in that species both need to be established .
What a rodent model can still do
Establish which cells change, and when, after a defined endocrine contrast: counts, protein per cell, state markers, transcripts. None of these tissue measures depends on a tracer's affinity.
What it cannot do by default
Stand in for a human imaging result. A null with a low-affinity tracer is uninformative, and a rodent-specific activation response is not a prediction for women.
This also bears on how existing animal results are read. A rise in rodent TSPO PET after a hormone manipulation would combine cell number with an activation response that human microglia do not appear to share; a human study could find the cell-number component and nothing else, and both results would be correct.
No tracer sees only one cell type
Every lens in this chapter weights several cell types, or carries an unresolved specificity question, or changes its meaning with species and cell state. The figure below makes that concrete on one field of real cells.
Choose a tracer, then switch between human and rodent and between surveying and reactive cells. The field does not change; what each lens would emphasise does. The weights are deliberately qualitative. They summarise the cellular statements quoted above and are not measured proportions, and where the sources say nothing about a combination, the panel says so instead of guessing.
One field of cells, six lenses
Schematic · qualitative weights
Species
Cells
TSPO
Two patterns stand out. The CSF1R lens is the only one close to a single cell type, and it is also the one whose radioligand has not shown specific binding: the cleanest cellular target sits behind the least resolved tracer gate. And the COX-2 lens goes dark in rodents while its target is present, the clearest case in this report of an available human tracer that would turn a standard animal design into a guaranteed null.
Design the bridge from the cell outwards
The opportunity is to choose an endocrine contrast, a time point and a context first, establish in tissue which cell quantity actually changes, and only then ask which tracer could see that change.
The usual order runs the other way: take an available tracer, scan an endocrine contrast, and interpret whatever moves as inflammation. The cases above show how that misleads. A TSPO change can be cell number or a different cell type; a P2X7 change can cancel inside a voxel; a CSF1R signal may not be CSF1R; a COX-2 null in rats is a property of the tracer. Starting from the cell makes each step testable on its own, and lets a negative result mean something.
Choose the biology first, the tracer last
Worked examples · hypothetical designs
A Delayed ovarian loss
Surgical removal of the ovaries in mice
Months, not days: changes grew between 14 days and 4 months
Healthy hypothalamus
Astrocyte reactivity and glial pathways are reported. Test first: more astrocytes, or more TSPO or MAO-B in each?
TSPO or MAO-B PET only then, after checking the reference tissue in ovariectomized animals
B Hormone after injury
Estradiol given to ovariectomized mice
Days
Nerve injury
P2X7 moves from neurons to microglia while total protein stays flat. Measure it cell by cell
A bulk P2X7 signal could stay flat while the biology changes: PET is the wrong first read-out
C The species gate
Any ovarian contrast in rats
Any
Inflammatory challenge
COX-2 rises in the tissue
The COX-2 tracer barely binds rat COX-2, so a null is uninformative. Study people, or a humanized model with its own caveat
The three threads are worked examples, not proposals. The first follows the delayed hypothalamic changes after ovariectomy and asks whether astrocyte number or per-cell target protein is what moves, before choosing between TSPO and MAO-B and before trusting a reference region. The second takes the P2X7 redistribution seriously: if the receptor moves between cell types after injury, a bulk read-out is the wrong first measurement. The third is the species gate. Each ends with a tracer only once the tissue has said what to look for.
HypothesisA small orthogonal exercise could tell a collaboration whether either TSPO or MAO-B is worth imaging after ovarian hormone loss: one endocrine contrast, two time points, and in the same tissue cell counts plus per-cell target protein for both. It would cost a fraction of a scan series and could make the eventual PET result interpretable.
Some resources lower the cost of starting. The COX-2 study deposited its data openly: a human dataset of 27 participants and a separate animal dataset whose 18 subject folders are labelled 12 mouse and 6 rat, both released into the public domain in the brain-imaging data standard . Only descriptors and folder listings were read. The human participant schema defines sex, age and weight and the animal schema sex and age; neither has a reproductive-stage field, which is an annotation finding rather than proof that hormone information exists nowhere. These data could support a methods exercise, for example how arterial and reference-tissue estimates diverge on a known cohort. They cannot estimate an endocrine effect. The ovariectomy transcript studies declare deposited RNA data and code (Bloom 2026; Saha 2024), not yet inventoried, and the human PET and pathology studies share data on request.
The next chapter turns to the vessels every tracer travels through, where the same discipline applies: a change in delivery can look exactly like a change in target.
What this chapter does not show
- That estrogen loss uniformly increases inflammatory PET signal. No study read here measured a human endocrine contrast with a neuroimmune tracer.
- That any tracer identifies one cell type or one cell state exclusively.
- That TSPO PET measures microglial activation per cell in humans. The human evidence points to cell number.
- That the hypothalamic age association in women reflects menopause. Reproductive stage was not recorded.
- That any selected non-TSPO tracer already measures a human hormone intervention. The absence of such a study in this bounded search is not proof that none exists.
- That COX-1 and COX-2 findings can stand in for each other, or that a working human tracer makes a standard rodent experiment informative.
- That CPPC measures CSF1R in vivo. Specific binding was not shown at baseline in the animal work read here, at abstract level.
06
Vascular physiology · inflow, perfusion, arrival, transport
Flow is biology, and a condition of every measurement
Ovarian hormones act on blood vessels, and every PET tracer reaches its target through those vessels. That gives vascular physiology two roles that are easy to confuse: something worth studying in itself, and a condition under which every molecular image is taken. This chapter keeps the two apart, and separates five quantities that all get called flow.
ObservedRelative regional flow, total arterial inflow, and tissue perfusion with arrival time each changed with an endocrine contrast in one human study. Estradiol alters capillary efflux within minutes in isolated rodent capillaries.
AttributionOnly the inflow study was randomised, and it was neutral overall with a dip at one visit. The perfusion study is associational and the PET study observational and relative.
DiscriminatorMeasure delivery in the same people as the molecular contrast, and model it: an arterial input, or a perfusion scan in the same session.
Next questionDoes a proposed endocrine imaging contrast survive measurement of its delivery physiology? A desk-based kinetic sensitivity check comes first.
Five quantities that share one word
Total arterial inflow, regional tissue perfusion, tracer delivery, barrier permeability and transporter function are different physical quantities with different units. A study that reports "blood flow" has usually measured one of them, and rarely the same one as the study it is compared with.
Start with what each instrument actually reads. Total arterial inflow is the volume of blood crossing a plane through the arteries that feed the brain, per minute: one number for the whole organ, in millilitres per minute. Tissue perfusion is the rate at which arterial blood reaches a given mass of tissue through its capillaries, conventionally in millilitres per 100 g per minute, and it can differ between regions while the total stays fixed. Relative regional flow is perfusion in one region divided by the mean over the whole brain. It is a dimensionless pattern, and by construction it cannot register a change that affects every region equally.
Arrival time is a fourth quantity, a delay rather than a rate: how long blood labelled in the neck takes to reach a tissue voxel. Delivery, in the sense a PET tracer cares about, is the influx constant K1, the product of perfusion and the fraction of tracer that leaves the capillary in a single pass. That fraction depends on the permeability and surface area of the capillary wall. Transporter function, finally, is active: efflux pumps in the capillary wall move some molecules back towards the blood, against passive diffusion, so a well-perfused region can still keep a substrate out.
These are not five estimates of one underlying flow, and they can move independently. A hormone could redistribute perfusion between regions with no change in total inflow; lower total inflow while local regulation holds tissue perfusion steady; shorten arrival time without changing perfusion; or alter an efflux pump without touching blood flow at all . A result reported as cerebral blood flow becomes interpretable once you know which of these was measured.
The bridge between perfusion and delivery is the Renkin–Crone relation. The fraction of tracer extracted in one capillary pass is E = 1 − e−PS/F, where PS is the permeability–surface-area product and F the perfusion, so that K1 = F × E. For a freely diffusible tracer such as oxygen-15 water, PS is large, E is close to one and K1 tracks perfusion. For a tracer whose passage is limited by the wall, E is small and K1 tracks PS instead, becoming nearly insensitive to perfusion. Where a given brain tracer sits on that continuum is a property of the tracer, and it decides how far a hormone-related perfusion change could reach its signal.
A relative map, two years apart
The oldest of the three human studies measured flow with oxygen-15 water PET, but what it reports is a pattern of relative change between two groups who chose their own treatment. It is evidence about a pattern, not about whether estrogen raises brain perfusion.
Maki and Resnick 2000 followed 12 women using estrogen replacement and 16 non-users from the Baltimore Longitudinal Study of Aging over two years, scanning each at rest and during verbal and figural recognition tasks . Every measurement used a 2.8 GBq bolus of oxygen-15 water and a 60-second acquisition; the isotope's half-life of about two minutes is what makes repeated injections in one session practical. The users were not randomised. Ten took conjugated equine estrogens, one estradiol and one a triple-estrogen preparation; six also received progesterone; and they had been treated for a mean of 15 years. The authors name the healthy-user bias themselves.
The 28 women are a follow-up subset of an earlier cross-sectional comparison of 15 users and 17 non-users, so the first-year images overlap with a published analysis and are not an independent replication . Across the three conditions combined, users showed larger longitudinal increases in relative flow in right hippocampus, entorhinal cortex and middle temporal gyrus, among other regions; non-users showed larger relative increases in pons, superior frontal gyrus and elsewhere. Performance on the in-scanner memory tasks did not differ between the groups.
The phrase that matters is in the methods: proportional normalisation. Every image was divided by its own global mean before the groups were compared, so "increase" means increase relative to the rest of that brain on that day . That is a sensible choice for detecting a regional pattern, and it leaves the study silent on the question a reader most wants answered, whether estrogen use changed how much blood the brain received.
A worked example, explicitly hypotheticalSuppose one woman's whole-brain flow fell 5% over two years and her hippocampal flow did not change at all. After proportional normalisation her hippocampus would show a relative increase of about 5.3% (1 ÷ 0.95), which the map cannot distinguish from a genuine local rise. The arithmetic also runs in reverse: a region can appear to fall because everything around it rose. And because relative values average to one by construction, part of what appears as a larger increase in non-users elsewhere is the mirror image of the users' relative gains. No value here comes from the study; it is the algebra of the normalisation the study used.
The statistical threshold was a voxel-level p < 0.01 combined with a cluster extent above 37 voxels, a common convention at the time that is not modern family-wise error control. With 12 and 16 women and many regions, some reported clusters would probably not survive a stricter test . None of this makes the study careless. It makes it a historical bridge between endocrine exposure and functional imaging, and a worked lesson in what normalisation removes.
Deep dive: the coordinate table, and the intervention this design is not
In the published tables, regions labelled right carry negative x coordinates (right hippocampus at x = −18), whereas in the standard Talairach convention negative x denotes the left hemisphere. The paper does not say which convention it used, so lateralised findings should be read with that ambiguity in mind .
The design that would separate hormone from self-selection is an intervention. Berman 1997, which Maki and Resnick cite, used oxygen-15 water PET in young women under three pharmacologically controlled states: ovarian suppression with a GnRH agonist, then suppression with estradiol or progesterone added back in a double-blind crossover. Under suppression alone the working-memory activation pattern was attenuated, and either hormone restored it . Maki and Resnick describe that study as finding no change in global flow with suppression; the original was not re-read for this review, so that statement is carried at the depth of a citing paper .
One randomised trial, one neutral average, one dip in the middle
The only randomised design among the three measured total inflow through the neck arteries, and found a dip at one visit that recovered at the next: an overall neutral result whose shape carries more information than its average.
Sorensen 2001 enrolled 16 naturally postmenopausal women, aged 55 ± 3 years, in a double-blind crossover: twelve weeks of a sequential hormone regimen and twelve weeks of matching placebo, in random order, three months apart . Each 28-day cycle gave 4 mg estradiol daily for 12 days, 4 mg estradiol with 1 mg norethindrone acetate for 10 days, and 1 mg estradiol for the last 6. Flow was measured with velocity-encoded phase-contrast MR in both internal carotid and both vertebral arteries and summed, at baseline and in weeks 2, 9 and 11 of each period, up to eight examinations per woman. Two women withdrew, one because of venous thrombosis; a trial of this size cannot speak to safety.
Active period · three 28-day cyclesDesign · visit positions approximate
04812 weeks
Baselinebefore treatment
About day 10estradiol alone: no reduction
Week 9after two progestogen cycles: lower than baseline
Week 11progestogen phase: back towards baseline
4 mg estradiol
4 mg estradiol + 1 mg norethindrone acetate
1 mg estradiol
The other twelve-week period gave matching placebo with the same visits; order was randomised, with a three-month washout between periods.
Total flow was lower than baseline at week 9, reported as −37 ± 15 mL/min (P = .01), and rose by 45 ± 19 mL/min between weeks 9 and 11, once the progestogen phase had resumed . The authors summarise this as an overall neutral effect. Their own reading of the dip is more interesting than the summary: no reduction appeared while estradiol was given alone at the start, and the week-9 visit came after two cycles of progestogen exposure and withdrawal, so they raise progestogen withdrawal, rather than estradiol, as the trigger . That makes this a study of an endocrine sequence, not of estradiol in isolation. The systemic circulation moved too: vascular resistance and blood pressure fell within about ten days of starting estradiol, which is a reminder that a hormone can act upstream of the brain.
One detail explains why this chapter draws no effect-size graphic from the paper. Flow was corrected for body surface area, and the legend gives the background mean as 461 ± 24 mL per minute per square metre, yet the changes are reported in mL/min. The reported +9.8% for the rise from week 9 to week 11 equals 45 divided by 461, which suggests either that the changes are in the corrected units and labelled otherwise, or that the percentage mixes two units. The text does not let a reader decide, and the figure images were not available to check . Until the original figures are recovered, the size of the dip stays unconverted.
CaveatThe paper's 123 cerebral flow measurements are not 123 people. They span up to eight visits in 16 women, two of whom withdrew, and repeated visits are correlated; the analysis used a crossover model with one treatment effect per visit. A placebo term was tested and dropped when it was not significant, and the reported effects come from that reduced model.
Total inflow is also blind to where the blood goes. The authors note that their global measurement does not contradict earlier reports of regional vasodilation, because blood can be redistributed between regions while the total stays the same . That is precisely the gap between this instrument and the previous one.
Perfusion and arrival time across the menstrual cycle
The newest study separates how much blood reaches tissue from how long it takes to arrive, and from how much oxygen the tissue uses. Higher hormone levels went with more perfusion and earlier arrival, and not with a detectable change in oxygen metabolism.
Wright 2026 scanned naturally cycling women with a mean age of about 23 in the early follicular, late follicular and mid-luteal phases, drawing blood for estradiol and progesterone at each session . Of 26 recruited, 21 contributed MRI data, giving 17, 17 and 18 observations across the three phases. Perfusion and arterial arrival time came from multi-delay pseudo-continuous arterial spin labelling at 3 T, with eleven post-labelling delays from 250 to 3,000 ms. Oxygen extraction was measured from venous blood signal and the metabolic rate of oxygen derived from it, and retinal vessel density and a modelled flow resistance came from optical coherence tomography angiography.
Across sessions, higher estradiol was associated with higher global perfusion and shorter arrival time, and progesterone, entered as the part of its variation not explained by estradiol, showed associations in the same directions . Neither hormone explained variation in oxygen extraction or oxygen metabolism. That combination is the paper's most useful contribution here. Delivery varied with endocrine state while the tissue's measured oxygen use showed no detectable change, so a perfusion association cannot simply be read as a metabolic one .
The design is associational, and the authors are candid about its limits. Phases were scheduled by counting days from menses, without ovulation tests, and the late-follicular estradiol peak was missed in several participants; they recommend measuring the hormone rather than assuming the phase . Blood pressure was not monitored. Residualising progesterone against estradiol separates the two statistically, which is not the same as varying them independently, and natural-cycle associations in young women do not transfer automatically to menopause or hormone therapy .
One sentence in the paper needs care. It describes both hormones as associated with "decreased global blood velocity (AAT)". Arrival time is a delay: the interval between labelling blood in the neck and that blood reaching a tissue voxel. A shorter interval means the label got there sooner. That could reflect faster transit somewhere along the route, a shorter effective path, or a change in how the arterial tree distributes blood, but it cannot mean slower blood, and velocity itself was not measured . This chapter keeps the measured endpoint, arrival time, and sets the mechanistic wording aside.
The data are public. The paper's data statement gives a G-Node repository DOI, and on 2 October 2026 that DOI resolved to a landing page describing MRI, retinal and hormone data from 26 volunteers at the three phases, offered as a 6.7 GiB archive under a CC BY 4.0 licence . The archive was not downloaded, so its contents, completeness and structure are unverified . A 2024 preprint is an earlier version of the same study, not a second cohort.
Three studies, three questionsRelative regional flow after normalisation, in self-selected long-term users (Maki and Resnick 2000). Total arterial inflow during a randomised sequential regimen (Sorensen 2001). Tissue perfusion and arrival time across a natural cycle (Wright 2026). They are not three measurements of one endpoint that disagree. They are three endpoints, in three endocrine contrasts, at three stages of life.
Where along the delivery chain each instrument readsDesign comparison · not pooled
- Feeding arteriesinflow · mL/min
- Regional sharedistribution of the total
- Capillary bedperfusion · mL/100 g/min · arrival · s
- Capillary wallpermeability · delivery K1
- Active transportefflux pumps
reads at: feeding arteries
Phase-contrast MR flow mapping
Total arterial inflow
- Reads
- Volume per minute through both carotid and both vertebral arteries, summed.
- Blind to
- Where the blood goes once inside; tissue perfusion; anything about a tracer.
Sorensen 2001 · randomised crossover · 16 enrolled
reads: regional share of tissue flow
Oxygen-15 water PET, globally normalised
Relative regional flow
- Reads
- Each region's flow divided by the whole-brain mean: a pattern.
- Blind to
- Any change shared by the whole brain, and absolute perfusion, which needs an arterial input.
Maki and Resnick 2000 · observational follow-up · 12 users, 16 non-users
reads at: capillary bed
Multi-delay arterial spin labelling
Tissue perfusion and arrival time
- Reads
- Labelled blood reaching tissue, and the delay before it arrives.
- Blind to
- Tracer extraction and binding; blood velocity; oxygen use, which was measured separately.
Wright 2026 · natural cycle, associational · 21 with MRI
reads at: wall and transport
Substrate PET for efflux transporters
Transport at the barrier
- Reads
- P-glycoprotein function, as the distribution volume of a substrate tracer.
- Blind to
- Perfusion as such, and whether any other tracer is a substrate.
van Assema 2012 · Salvi de Souza 2025 · cross-sectional · 35 and 20
Read side by side, the comparison suggests a working rule rather than a correction. A hormone contrast in any molecular PET study arrives with some vascular state attached. Which part of that state matters depends on the tracer and on the summary measure it is read with, which is the subject of the next section.
Why a distribution volume is not a flow measurement
In a compartment model, delivery enters through K1 and binding through k3 and k4. The equilibrium distribution volume depends on their ratios, not on flow. Yet a finite scan, an imperfect input function or a misspecified model can still let delivery leak into the estimate.
A compartment model describes tracer moving from arterial plasma into tissue with rate constant K1 and back with k2, and, if it binds, onto its target with k3 and off again with k4. The quantity most kinetic studies report is the total distribution volume, VT: the tissue-to-plasma concentration ratio the system would reach at equilibrium. It is K1/k2 in a one-tissue model and K1/k2 × (1 + k3/k4) in a two-tissue model, and the binding potential relative to nondisplaceable uptake is k3/k4.
Arterial plasmaCP · the input function
deliveryK1k2
Free and nonspecifically boundCND · in tissue
bindingk3k4
Specifically boundCS · on the target
one-tissue model: these two behave as a single compartment
DeliveryK1 = F × E, with E = 1 − e−PS/F. A change in perfusion F scales K1 and k2 together.
EffluxAn active pump adds to the exit route, raising k2 or lowering effective K1, and so changes their ratio.
BindingTarget density and affinity enter through k3 and k4; BPND = k3/k4.
One-tissueVT = K1 / k2
Two-tissueVT = K1 / k2 × (1 + k3 / k4)
Flow aloneleaves VT unchanged in a correctly specified model, and changes how fast the tissue gets there
Can still bias VTinput-function error · a scan too short for equilibrium · an omitted blood-volume term · the wrong number of compartments
The crucial property sits in the ratio. If perfusion changes, K1 and k2 change together, because the same passive exchange across the capillary governs entry and exit, so K1/k2, and with it VT, stays where it was. A correctly specified distribution-volume model is therefore not a flow measurement. What changes with perfusion is how fast the tissue approaches equilibrium, and anything read before equilibrium, including a single late time window, can move with delivery even when binding has not changed .
Efflux is different in kind. An active pump in the capillary wall can speed exit, or reduce effective entry, without any change in perfusion, and that does change the ratio K1/k2. This is why transporter PET reads P-glycoprotein function from the distribution volume of a substrate tracer: for those tracers VT is expected to move with transport . In the model, flow alone does not change VT; transport can.
Finite data and input error are where delivery can still reach the estimate. VT is fitted to a scan of finite length with noise, against an input function with errors of its own. An image-derived input can be delayed or dispersed relative to tissue; metabolite correction and the plasma free fraction must be right for the parent tracer; a blood-volume term left out of the model leaves vascular signal mixed into tissue; and a two-tissue system fitted with one compartment, or the reverse, biases what comes out. Any of these errors can differ between endocrine states if the states differ in cardiac output, blood composition or vascular volume . That is the narrow, defensible sense in which vascular physiology is a measurement condition for molecular PET.
Reference-region methods sit in between. A global change in delivery reaches target and reference alike, but it cancels in their ratio only if the two regions share the same kinetics. Where binding slows the target and the reference equilibrates quickly, a global delivery change can move the ratio more than it moves either region, because the two are caught at different points on their way to equilibrium . Chapter 1 discusses the reference region of the human estrogen-receptor tracer; the explorer below lets you try the kinetics with schematic curves.
Change delivery, binding or efflux. Watch which summary measures move.
Schematic · arbitrary units · no fitted values
Delivery change applies to
Two things the explorer cannot show deserve a sentence. It assumes one well-mixed plasma input, whereas real inputs differ by region in delay and dispersion. And its parameters are arbitrary: whether a hormone-scale change in perfusion would move a particular tracer's late uptake by a fraction of a per cent or by several per cent depends on that tracer's own kinetics. That is an empirical question with a desk-sized first step.
The barrier wall is a separate, hormone-sensitive question
Efflux pumps in brain capillaries respond to estradiol within minutes in isolated rodent tissue. That is delivery biology in its own right, and it says nothing yet about whether any estrogen-related tracer is a substrate.
Two isolated-capillary studies make the point, and disagree on a detail. Hartz 2010 found that nanomolar estradiol reduced the transport activity of breast cancer resistance protein (BCRP) in rat and mouse brain capillaries within minutes, without new transcription or translation, reversibly, and through either estrogen receptor subtype . Banks 2024, in freshly isolated mouse capillaries, found a rapid decrease in Bcrp transport driven by extranuclear ERα and AMPK signalling: an ERα-selective agonist reproduced it, while ERβ- and GPER-selective agonists did not . The response was specific to Bcrp rather than P-glycoprotein or Mrp2 and separable from changes in transporter protein, ATP depletion or tight-junction leakiness, and females had lower baseline Bcrp expression, which ovariectomy normalised.
The receptor-subtype disagreement is real. The later authors attribute it to differences in experimental design, species, strain or hormonal history rather than to an error in either study. Both results share a practical shape: estrogen signalling can change active efflux at the barrier within minutes, whether or not the barrier has become leaky.
Banks 2024 also exposed capillaries to endocrine disruptors and receptor modulators. Bisphenols A and S lowered Bcrp transport, and tamoxifen increased it. That detail matters for imaging. A receptor modulator that changes a transporter has changed the delivery of every substrate that transporter handles. In a PET study, lower signal after such a drug could mean less binding or less delivery, and only a design that measures both can tell them apart .
In living people, efflux can be imaged with substrate tracers. van Assema 2012 scanned 35 healthy adults in three age groups with (R)-[11C]verapamil, using a 60-minute dynamic acquisition and a metabolite-corrected arterial input, and read P-glycoprotein function from VT under a constrained two-tissue model . VT rose with age in men; young and older women were comparable, and young women had higher VT than young men. The sex comparison rests on small groups, with four young, five middle-aged and seven older women. Premenopausal women were scanned during menstruation to limit hormonal variation, and hormone levels were not measured.
Salvi de Souza 2025 asked the sex question directly with [18F]MC225 in 20 adults aged 55 or older, 11 men and 9 women. The input was image-derived from the carotid arteries but calibrated against arterial samples and corrected for plasma-to-blood ratio and parent fraction, and VT came from a reversible two-tissue model . Regional VT did not differ between the sexes, with effect sizes below 0.2, and neither did blood concentrations, parent fractions or rate constants. The authors call for studies in younger people across hormonal cycles .
Null resultA small null is not equivalence. Nine women and eleven men cannot establish that P-glycoprotein function is identical between the sexes, and an older cohort is where ovarian hormone differences between them are smallest. The two human studies also differ in tracer, model, input method and age range, so they are not contradictory measurements of a single quantity.
None of the studies reviewed here tested whether FES, or any other estrogen-related PET tracer, is a substrate of BCRP or P-glycoprotein . Chapter 1 notes that FES enters rat brain readily, which is not what a strongly efflux-limited molecule looks like. That argues against efflux as the dominant limit on brain FES signal without settling whether hormone-sensitive transport could modulate it, and the substrate question can be answered directly with standard transport assays.
A genotype that changes the vascular answer
In one mouse study, the cerebrovascular response to ovarian-hormone loss and estradiol depended on APOE genotype. That motivates testing for effect modification, not genotype-based prescribing.
Kehmeier 2026 studied young female mice homozygous for human APOE3 or APOE4, about six months old and fed a high-fat diet, which were left intact, ovariectomised, or ovariectomised and given estradiol, with 19 to 20 animals per group . In APOE3 mice, ovariectomy impaired endothelium-dependent dilation of the posterior cerebral artery and estradiol restored it; carotid passive stiffness rose with ovariectomy and fell with estradiol; and estradiol raised mitochondrial complex I respiration in cerebral arteries and arterioles. In APOE4 mice none of these endpoints responded to ovariectomy or estradiol. Not every outcome followed that pattern: the preprint version of the same study reports lower cerebral artery stiffness with estradiol in APOE4 but not APOE3 mice.
The authors close by suggesting that genotype may be a consideration when weighing hormone therapy . That is the step this report does not take. The animals were young, homozygous, on a high-fat diet and surgically ovariectomised, an abrupt loss unlike the menopausal transition (chapter 3), and the endpoints were vessel function, not imaging. What transfers is a design principle: if the vascular response to an endocrine change differs by subgroup, any vascular contribution to an imaging contrast may differ too, and the right analysis tests for that interaction instead of applying one correction to everyone .
What each study can carry
The vascular and efflux evidence spans three instruments in humans, two ex-vivo capillary preparations and one mouse vessel study. Each row answers a different question, and none is a measurement of an estrogen-related tracer's delivery.
| Study | Design and species | Endpoint | n, as verified | What it can show | What it cannot | Read |
|---|---|---|---|---|---|---|
| Maki and Resnick 2000 | Observational two-year follow-up of treatment users and non-users; human | Relative regional flow, oxygen-15 water PET, globally normalised | 12 users, 16 non-users; a subset of an earlier 15 and 17 | Different patterns of relative change between self-selected groups | That estrogen raised perfusion, or caused the pattern; absolute flow | Full text; not every table or figure |
| Sorensen 2001 | Randomised double-blind crossover, sequential estradiol and progestogen versus placebo; human | Total arterial inflow, phase-contrast MR, carotid and vertebral | 16 enrolled, 2 withdrew; 123 measurements | A timing-dependent dip and recovery within an endocrine sequence | An estradiol-only effect, regional perfusion, or a converted effect size (units unresolved) | Full text; figures missing |
| Wright 2026 | Repeated measures across three menstrual-cycle phases; human | Tissue perfusion and arrival time (multi-delay ASL); oxygen extraction and metabolism | 26 recruited; 21 with MRI (17, 17, 18 per phase) | Hormone-associated perfusion and arrival differences without detectable oxygen-metabolism change | Hormone causation, menopause transfer, or velocity | Full text; no figures or supplement |
| Berman 1997 | GnRH-agonist suppression with estradiol or progesterone add-back, crossover; human | Task-related regional flow, oxygen-15 water PET | Not verified here | That a controlled hormone intervention can change an activation pattern | Anything quantitative in this review; original not re-read | Abstract only |
| Hartz 2010 | Isolated brain capillaries; rat and mouse | BCRP transport activity | Not verified here | Rapid, reversible, non-genomic estradiol reduction of efflux | Human relevance, tracer substrate status | Abstract and indexed excerpts |
| Banks 2024 | Freshly isolated brain capillaries, sex and ovariectomy comparisons; mouse | Bcrp transport activity and expression | Not verified here | ERα-AMPK control of efflux, separable from leakiness; modulator effects | Human menopause, PET contrast, FES substrate status | Substantial indexed sections |
| van Assema 2012 | Cross-sectional age and sex comparison; human | P-glycoprotein function, verapamil VT, arterial input | 35 (women: 4 young, 5 middle-aged, 7 older) | Sex-dependent age patterns in transporter function | Hormone effects (not measured); endocrine intervention | Abstract and selected sections |
| Salvi de Souza 2025 | Cross-sectional sex comparison, age 55 and over; human | P-glycoprotein function, MC225 VT, calibrated image-derived input | 20 (11 men, 9 women) | No detectable sex difference at this size and age | Equivalence; cycle or menopause effects | Abstract and selected sections |
| Kehmeier 2026 | Intact, ovariectomy and ovariectomy-plus-estradiol by APOE genotype, high-fat diet; mouse | Cerebral artery dilation, stiffness, vascular mitochondrial respiration | 19 to 20 per group | Genotype-dependent vascular hormone responses | Imaging effects; any guidance for people | Abstract and indexed sections |
The table also shows where the evidence is thin. Only one human study randomised a hormone, and it measured the instrument least able to see regional effects. The best-phenotyped study is associational. The transporter studies did not manipulate or even measure hormones. These are reasons to design the next study well, not reasons to dismiss what has been seen.
Does the endocrine contrast survive its delivery physiology?
The opportunity is not a universal perfusion correction. It is to ask, for one specific contrast and one tracer, whether the effect survives measurement of the delivery physiology that could produce it.
The evidence here gives no warrant for a blanket correction that attributes every hormone-related PET difference to perfusion, and vascular change does not invalidate molecular PET . A correctly modelled distribution volume is insensitive to flow by construction, a reference ratio can absorb a global change when target and reference share kinetics, and the perfusion associations found so far come from a natural cycle in young women, one observational study and one small randomised trial of a sequential regimen. Equally, nothing reviewed here shows that delivery is irrelevant for any particular estrogen-related contrast. The productive move is to make the question specific.
Three routes differ in cost and in what they can settle. The desk exercise needs no new participants, and its perfusion side could later be grounded in the public cycle-phase dataset once that has been inventoried . The paired design is the only one that lets delivery enter the model as a measured covariate rather than an assumption .
1Desk model sensitivity
Take a tracer's published rate constants, impose a perfusion change of the size seen across a natural cycle, and compute how far each summary measure the tracer is read with would move.
Needs: kinetic parameters and a calculation2Input-method comparison
Estimate the same endocrine contrast with the full arterial-input model and with the simplified method the field uses, and see whether the two agree.
Needs: an existing dataset with arterial sampling and endocrine annotation3Paired modalities
Measure perfusion or arrival time in the same session as the molecular scan, for example on a combined PET/MR system.
Needs: a future studyHypothesisA contrast that survives is stronger for it. If a menopause-stage or cycle-phase difference in a molecular tracer persists once delivery is measured and modelled, the vascular explanation is excluded for that tracer and that design. If it shrinks, the shrinkage is itself a result: it would show that part of an endocrine imaging signal travels through the vasculature, which is biology worth having.
That framing keeps vascular physiology in its first role as well, as biology. Estrogen-sensitive efflux, genotype-dependent endothelial responses and cycle-linked perfusion are endocrine effects in their own right, and a collaboration could study them for their own sake. The next chapter turns from the vessel to the molecule: what happens when chemistry, rather than physiology, is the gate.
What this chapter does not show
- That estrogen raises brain blood flow. One observational study reports relative regional patterns, one randomised trial an overall neutral total inflow with a dip at one visit, and one natural-cycle study associations.
- That the three perfusion studies contradict one another. They measured different endpoints, in different endocrine contrasts, at different ages.
- That a shorter arrival time means slower blood.
- That FES or any other estrogen-related tracer is a substrate of BCRP or P-glycoprotein.
- That vascular change invalidates molecular PET, or that one perfusion correction applies to every tracer and summary measure.
- That APOE genotype should guide hormone therapy. One mouse study motivates an interaction test.
- That a small null in older adults establishes equal transporter function between the sexes, or across hormonal states.
07
Chemistry and drug development · DPN, fluoromoxestrol, erteberel, equol, DEEPER
Every failure in this chapter is at a different gate
A molecule that is to measure estrogen receptors in a living brain has to clear five separate requirements, and the evidence for each one is a different experiment. The compounds people point to as cautionary tales did not fail the same way, or even at the same step. Reading them as one story about difficulty throws away the only thing they are actually good for: telling you which experiment is still missing.
ObservedCompounds exist with large subtype preference, with favourable preclinical profiles, and with measured responses in people. No compound has a documented chain from an exact structure through unbound brain exposure to a target-specific brain signal.
AttributionEach documented stop has an identified cause: insufficient absolute affinity for one, a species difference in plasma protein binding and metabolism for another, and for the drugs, an endpoint that was never occupancy.
DiscriminatorFor one named candidate, measure intact parent and unbound fraction in brain tissue at the same time as a baseline and blocked pair — the experiment none of these programmes has reported.
Next questionWhich single candidate has the shortest remaining chain of missing measurements? That is a desk exercise on published material, and it comes before any new chemistry.
Five gates, and they do not substitute for one another
A usable brain tracer needs an exact chemical identity, adequate affinity and selectivity, enough intact unbound compound at the target, a signal that is demonstrably the target, and a way to turn that signal into a number. Passing one of these says nothing at all about the next.
The way this field usually talks about chemistry collapses the five into a single adjective. A compound is promising, or it failed. Both words destroy the information. Each gate is tested by a different experiment, in a different system, with a different unit, and a compound can sail through four and stop dead at the fifth — which is in fact the normal outcome, because the gates get harder in order and the evidence gets more expensive.
Gate one is identity: which molecule, which isomer, which deposited record. Gate two is pharmacology: affinity and selectivity, which are two numbers and not one. Gate three is exposure: how much intact parent, unbound, is present where the receptors are. Gate four is specificity: whether the signal in the brain is the target rather than everything else the isotope is attached to. Gate five is quantification: whether the signal can be turned into a reliable number, repeatedly, with an input function and a reference region someone has actually tested.
Each case sits at the gate its published evidence actually reaches, and no further. A compound has to pass all five; passing one says nothing about the next.
1Exact identity
Which molecule, which isomer, which deposited record
A public record of the fluorinated moxestrol analogue carries both “16β” and “16α” in its own synonym listunresolved
2Affinity and selectivity
Two numbers, not one — and in which assay
DPN analogue 6d: a 272-fold β/α preference with ERβ affinity at 6.25% of estradiol. Its makers stop development herestops here
3Parent and unbound exposure
Intact parent, not radioactivity; unbound, not unconjugated
S-equol: under 1% of the plasma total is unconjugated — which is not the same fraction as protein-unboundnot yet shown
Erteberel: 97.2–99.5% plasma protein bound, and the brain evidence is carbon-14-associated materialnot yet shown
4Target-specific brain signal
Displaceable binding where the question is, not where it is easy
16β-fluoromoxestrol: no tumour localisation in the three known receptor-positive cancers of a twelve-woman series — breast, not brainstops here
[¹⁸F]PVBO: defluorination puts activity in bone, and the skull surrounds the brainnot yet shown
5Reliable quantification
An input function, a reference you have tested, a repeat scan
A higher-sensitivity scanner improves counts and blood-curve estimation. It cannot make a non-specific signal specificnot yet shown
No compound in this chapter has documented evidence at gate 5 for a brain measurement. The cases are placed by what was measured, not by how promising a compound looks.
The figure has a deliberate shape: it empties out to the right. That is the chapter's main finding and it is worth stating plainly before the evidence. For brain estrogen-receptor imaging, no compound in the inspected literature has documented evidence at gate five, and the two compounds with the most informative published failures stopped at gates two and four respectively . Everything further right is programme, prediction or plan.
Gate one is bookkeeping, and the public record is not always clean
Before any comparison is meaningful, each compound has to be pinned to an exact structure with its stereochemistry, the assay it was measured in, the comparator that assay used and the species. This sounds like clerical work. It is where several published comparisons already fail.
The six structures below are drawn from their deposited PubChem records, parsed and laid out by RDKit. Nothing here is sketched from memory, and for each one the molecular formula and the hash of the structure computed from the record match what the database holds. They are not decoration: a reader who wants to understand why a 16α fluorine is tolerated while an 11β methoxy group changes a molecule's fate in a human body needs to see where those substituents sit.
Real structures · RDKit from deposited PubChem records · retrieved 2 October 2026
Estradiol
the ligand every assay below is scaled against
CID 5757 · C18H24O2 · VOXZDWNPVJITMN…
16α-fluoroestradiol (FES)
the tracer in use; one substitution at 16α
CID 10401972 · C18H23FO2 · KDLLNMRYZGUVMA…
Moxestrol
parent of the fluorinated analogue below
CID 11954041 · C21H26O3 · MTMZZIPTQITGCY…
DPN
parent of the 2009 series; one unassigned stereocentre
CID 102614 · C15H13NO2 · GHZHWDWADLAOIQ…
DPN analogue 6d
the most selective analogue in that series
CID 44219700 · C15H12FNO2 · IEDQGJLNQLQYSA…
Erteberel (LY500307)
the drug given in the schizophrenia trial
CID 10286159 · C18H18O3 · XIESSJVMWNJCGZ…
Three readings of that plate matter for what follows. The first is how little separates the top row. 16α-fluoroestradiol differs from estradiol by one fluorine, and moxestrol adds a methoxy group at the 11β position and an ethynyl group at 17α to the same four-ring skeleton. These are small changes to a common core, and they produce entirely different fates in a human body.
The second reading is the bottom row, which is not steroidal at all. DPN is two phenol rings joined by a short chain with a nitrile; the analogue beside it adds one fluorine; erteberel closes a ring system onto a phenol. They reach the same pocket by a different route, which is why they can prefer one receptor subtype so strongly — and also why their absolute grip is weaker.
The third reading is the one the plate cannot show, and it is the chapter's first concrete finding. The fluorinated moxestrol analogue that produced the human imaging result discussed below is not drawn here, because its public record does not unambiguously state which isomer it is. The deposited entry's own synonym list contains both "16β-[18F]fluoromoxestrol" and a systematic name specifying the 16α configuration, and its computed name gives a single stereodescriptor at that carbon without resolving which convention produced it . The primary article is unambiguous — it studies the 16β isomer. The database record is not.
CaveatThat is a small thing and an instructive one. A reader assembling a compound comparison by pulling structures from a database, as is now routine, would have imported an ambiguity at gate one and carried it through every subsequent column. The rule this chapter follows is to draw only what a record states unambiguously, and to say so when it does not.
A second bookkeeping point is visible in the plate itself. Both diarylpropionitriles have one asymmetric carbon and both deposited records leave it unassigned . The synthesis in the source article introduces that centre by reduction and reports no separation of the resulting forms. The binding numbers quoted in the next section are therefore properties of a mixture, which is the honest way to read them and not a criticism of the work.
A ratio can rise because its denominator fell
The diarylpropionitrile series is the field's standard cautionary tale about subtype selectivity. Read closely it says something sharper than "selectivity is not enough": it shows a selectivity ratio improving while both affinities get worse.
Moon 2009 made nine new analogues of DPN, each carrying a small substituent at one ring position, and measured their affinity for purified human ERα and ERβ in a competitive assay against tritiated estradiol . The results are reported as relative binding affinity: estradiol is set to 100 and everything else is a per cent of it. In that same assay system, estradiol binds ERα with a dissociation constant of 0.2 nM and ERβ with 0.5 nM, which is the anchor that makes the per-cent figures interpretable at all.
Relative binding affinity, per cent of estradiol
ERβERαβ/α
Estradiolthe comparator, 100 by definition
—
DPN (1a)the parent of the series
72×
1c, ethyl at R₁the best β affinity in Table 1
4×
1e, ortho-methylthe promising lead
69×
6a, meta-methylthe same group, moved
139×
6d, meta-fluorothe most selective
272×
13, meta-iodolabellable for SPECT
140×
11a, fluoroethyleasiest to label with ¹⁸F
58×
20, hydroxymethylthe accidental product
19×
0.0010.010.1110100
From 1e to 6a the same methyl group moves one ring position: ERβ affinity falls 36-fold, ERα affinity falls further, and the ratio therefore doubles. A rising ratio can be a falling denominator.
Relative binding affinity is a per-cent displacement figure in one assay, not a dissociation constant. In that same assay estradiol binds ERα with a Kd of 0.2 nM and ERβ with 0.5 nM.
Follow the fourth and fifth rows. Compound 1e carries a methyl group at one ring position: ERβ affinity 60% of estradiol, ERα 0.87%, a 69-fold preference — a genuinely attractive starting point. Moving that same methyl group one position along the ring gives compound 6a, and ERβ affinity collapses 36-fold to 1.67% . The selectivity ratio, meanwhile, doubles, to 139-fold. Nothing improved. The ERα affinity simply fell further than the ERβ affinity did, and the ratio obediently rose.
What to carry forwardA selectivity ratio has two ways to get bigger, and only one of them is good news. Ranking candidate scaffolds on subtype preference alone will systematically promote compounds that bind nothing very well.
The most selective compound in the series, the meta-fluoro analogue 6d, reaches 272-fold — and holds 6.25% of estradiol's ERβ affinity, which is to say it binds its preferred target roughly sixteen times more weakly than the endogenous hormone does. The authors' own conclusion is the right one and they state it without hedging: despite the selectivities, the absolute affinities "are not good enough for them to be considered useful as potential PET or SPECT imaging agents" . They also note that labelling the most favourable compound with fluorine-18 would itself be difficult, because the fluorine sits on an aromatic ring next to a phenol rather than on an aliphatic chain.
This is the single most misread result in the chapter's source material, so it is worth being explicit about what it is. It is an in vitro candidate-prioritisation decision, made by chemists, on purified receptor protein, published as a negative structure–activity finding. It is not a brain imaging failure, a barrier failure or a human result of any kind . No animal was scanned. The compound stopped at gate two and the paper says so in its title's register: these are "selective ligands", evaluated and set aside.
One detail of the series deserves to survive into any future candidate list. The two analogues designed to be easy to label with fluorine-18 — the fluoroethyl and fluoropropyl compounds, where a radiolabel could be introduced by a simple aliphatic substitution — came out at 1.38% and 0.896% ERβ affinity with 58- and 45-fold selectivity . The compound that was easiest to make was the weakest; the compound with the best numbers was the hardest to label. That trade-off is structural, not incidental, and it reappears below in a different molecule's defluorination problem.
The tracer that worked in rats and not in women
A fluorinated moxestrol analogue beat every one of more than twenty candidate estrogens in the rat screen, went to people on the strength of that, and localised none of the three known receptor-positive tumours it was given the chance to find. The explanation turned out to be a protein that rats do not have.
Jonson 1999 reports both halves of the story . In the rat screen the fluorinated moxestrol analogue had high receptor affinity, low affinity for the plasma binding globulin, very high uterine uptake, excellent target-to-background selectivity and slow metabolism. Those are, item by item, the properties a tracer is supposed to have. In the human series, twelve women with suspicious breast findings were scanned. Seven had primary carcinoma, three of them with receptor-positive tumours by assay. Uptake above surrounding tissue was seen at one lesion, and the authors write that it may be an artefact of patient movement during the scan.
12
women scanned in the human series
3
of them with a confirmed receptor-positive tumour
31× / 2×
how much faster hepatocytes consumed the established tracer than its rival, in immature rat / in human
26%
fall in that consumption rate when the human binding globulin was added
The second half of the paper is the part worth keeping. The authors took hepatocytes from immature rats, mature rats, baboons and a human donor, and measured how fast each cell population consumed each tracer. In immature rat cells — the exact screening system that had selected the compound — the established tracer was metabolised on average 31 times faster than its rival. In mature rat cells the advantage shrank to about threefold, and in baboon and human cells to about twofold . The compound's whole advantage was an artefact of the screening species.
Their proposed explanation is the sex hormone-binding globulin, which rats do not have. Relative to estradiol at 100, the established tracer's affinity for that globulin is 9.5 and the moxestrol analogue's is 0.037 — the low value it had been selected for . Adding purified human globulin to mature rat hepatocytes slowed the established tracer's consumption by 26% in a direct comparison, which is a measured effect rather than an argument . The free-hormone intuition says a heavily protein-bound ligand should reach its target less well. Here the opposite held: being bound protected the molecule from the liver long enough to be delivered.
Two boundaries keep this from being the barrier parable it is often used as. It is a breast-tumour imaging result: nothing in it tests entry into the brain, and the tumours in question sit outside the barrier entirely . And three known receptor-positive tumours is a very small denominator — the result is a clear signal that something was wrong, not a precise estimate of how wrong. What the paper establishes is the mechanism of a gate-four failure in one organ, plus a screening lesson of unusual generality: the species that selects your compound can be the species that disqualifies it.
A measured response is not a measured occupancy
Three drug programmes have taken receptor-β-preferring compounds into people. Their endpoints are a working-memory contrast on MRI, an enzyme activity in blood platelets, and the stiffness of an artery. Each is a real measurement. None of them is occupancy.
The most instructive is a phase 2 trial of erteberel in men with schizophrenia, registered as NCT01874756 . Ninety-five participants were randomised across placebo and three daily doses for eight weeks. The trial was terminated, and the registry states the reason plainly: funding ended. Results are posted, which is more than most terminated trials offer.
Among its six primary measures, one is listed as "Cortical Target Engagement". Its description defines it as a change in frontal-parietal activation during a working-memory task on MRI . The posted values are regression coefficients, and they rise slightly from baseline to week eight in every arm, placebo included, with standard deviations larger than the changes. Whatever that outcome measured, it is a downstream functional contrast several steps removed from a receptor, and calling it target engagement in a registry field makes a real measurement sound like a different and much stronger one .
Deep dive: how this trial argued for central selectivity, and why that argument runs backwards
The protocol reports, from the sponsor's own data files, an ERα affinity of 2.04 nM and an ERβ affinity of 0.16 nM — about a twelvefold preference, far more modest than the hundredfold ratios of the chemistry literature but attached to genuinely strong absolute binding . It also reports plasma protein binding of 97.2% to 99.5% across mouse, rat, monkey and human.
Selectivity in the trial was monitored by a different route. Suppression of circulating testosterone is mediated by ERα and not ERβ, so the absence of testosterone suppression was taken as evidence that the dose was not engaging ERα . The posted results show that criterion met completely: no participant in any arm, at any of weeks 2, 4 and 8, met the pre-specified 50% reduction .
Read carefully, that is an argument from a peripheral absence. It bounds how much of one receptor subtype was engaged somewhere in the body. It cannot establish how much of the other subtype was engaged in the brain, and the trial's design contains nothing that could. The logic is sound for its actual purpose, which is dose safety; it becomes a claim about central pharmacology only when quoted out of the protocol .
The protocol's one direct statement about brain entry is that the compound "readily enters the CNS compartment with quantifiable levels of C-14-LY500307 in cerebrum, cerebellum, medulla and olfactory bulb" . Carbon-14-associated material is radioactivity, not the intact parent molecule, and tissue concentration is not unbound concentration. With 97.2% to 99.5% of the compound protein-bound in plasma, the gap between total and free is between one and three orders of magnitude, and nothing in the inspected documents measures it.
One bookkeeping note, since this report counts denominators. The registry's enrollment is 95; the posted participant flow starts 29, 10, 29 and 27, which also sums to 95; the outcome tables use denominators of 29, 10, 29 and 25, which sum to 93. A separate conference report gives 94 randomised. All three are in print and the mapping between them is unpublished .
Equol is the second case, and it has the clearest exposure data of any compound here — which is exactly why it is useful. Jackson 2011 reports that under 1% of the plasma total circulates as the unconjugated compound . That is a statement about chemical form: more than 99% has been conjugated by the body into something else carrying the same name in a total-concentration assay.
Unconjugated
Not chemically joined to a conjugating group — the molecule is still itself. For equol this is under 1% of the plasma total.
Unbound
Not held by plasma proteins — the molecule is free in solution and available to cross into tissue. This is a different fraction of a different denominator, and for equol it has not been reported here.
Those two words get used interchangeably and they are not the same measurement. The unbound fraction of the unconjugated 1% is the quantity that governs delivery, and nothing in the inspected sources reports it . Wilkins 2017 gave fifteen women with Alzheimer's disease two weeks of the compound and measured cytochrome oxidase activity in their blood platelets, with eleven of the fifteen meeting a response definition at a reported p below 0.06 . A single-arm peripheral enzyme response is a long way from a receptor in a brain, and the authors present it as a pilot.
The third programme is the largest and the most carefully built. Sekikawa 2025 reports the design of the ACE trial, which randomised 369 adults aged 65 to 85 to 10 mg a day of equol or placebo for two years across three sites. Its primary endpoint is the progression of arterial stiffness measured by pulse wave velocity; white-matter lesion volume on MRI and a cognitive composite are secondary. Checked on 2 October 2026, the registry record NCT05741060 read active but not recruiting, with no results posted and an estimated primary completion at the end of that month .
None of that is a criticism. It is a well-powered trial of a real clinical question. It is simply not evidence about receptor occupancy in the brain, and it was never designed to be. The design paper contains one discrepancy worth preserving rather than smoothing: its results text gives arm sizes of 186 and 185 while its abstract and its baseline table give 185 and 184, for the same total of 369 .
| Compound | Binding assay actually inspected | Chemical species in plasma | Protein-unbound fraction | Brain exposure evidence | Endpoint measured in people | The missing link |
|---|---|---|---|---|---|---|
| DPN analogue 6d | Competitive radiometric binding, purified human ERα and ERβ: 0.023% and 6.25% of estradiol, 272-fold | Not reported | Not reported | None; no in vivo work in this article | None; the compound was never given to a person | Everything after gate two. The authors stopped because the absolute affinity was inadequate |
| 16β-fluoromoxestrol | Rat screening assays reported as receptor affinity and globulin affinity; relative globulin binding 0.037 against estradiol's 100 | Metabolic consumption rates measured per cell in four hepatocyte preparations; metabolites not isolated | Not measured; the binding-globulin argument is about a different protein pool | None in brain. A whole-body clinical acquisition centred on the breast | Qualitative focal uptake at a breast lesion, read by two observers | Any brain measurement at all. The failure is documented in tumour, which is outside the barrier |
| Erteberel (LY500307) | Sponsor data files quoted in the protocol: ERα 2.04 nM, ERβ 0.16 nM | Parent and metabolites distinguished in preclinical pharmacokinetics; brain evidence is carbon-14-associated material | Not reported; 97.2% to 99.5% bound across four species | Radioactivity quantifiable in cerebrum, cerebellum, medulla and olfactory bulb | Negative symptoms, two cognitive composites, a working-memory MRI contrast, testosterone, QTc | Intact parent, unbound, at a brain receptor — and any occupancy measurement |
| S-equol | Not read at primary level for this review | Under 1% of plasma total is unconjugated | Not reported | Asserted in a review; no measurement inspected | Platelet mitochondrial enzyme activity (15 women); arterial stiffness, white-matter lesions, cognition (369 adults, ongoing) | Unbound concentration, and anything connecting a peripheral or vascular endpoint to a brain receptor |
| [18F]PVBO | Subtype preference reported in the published abstract; full body and supplement not read | Not inspected | Not inspected | Xenograft uptake; moderate defluorination with bone accumulation reported in mice | None; preclinical | A brain experiment, and a solution to label loss that puts activity in the skull |
| Fluorine-18 ERα probe (GDC series) | Indexed abstract only; no values carried forward | Not inspected | Not inspected | None inspected | None; preclinical | The original text. Exact labelled structure, affinity, molar activity, metabolites and biodistribution are all unread |
| DEEPER candidate ligands | None published | Not applicable | Not applicable | Barrier-permeability experiments specified as tasks: endothelial Transwell cultures, co-cultures, assembloids | None | Results. The programme establishes that the question is being worked on |
Read down the last column and the chapter's argument becomes a list rather than a mood. Four of these rows are missing the same measurement — intact, unbound compound where the receptors are — and two of them are missing it because nobody has looked rather than because anyone looked and failed. That is a considerably more encouraging situation than "the chemistry is hard", and it points at a specific experiment rather than at a feeling about difficulty .
Predictions are the cheapest part of the chain, and the easiest to over-read
A recent perspective from this literature lays out the candidate landscape in full and attaches a computed barrier-permeation call to each compound. The landscape is the useful part. The calls are predictions from structure alone, and the authors say so.
Arjmand 2023 is the most complete map of the problem available, and it begins by making a distinction the rest of this chapter has quietly assumed . Estrogen receptors are not only nuclear. The same proteins appear at the plasma membrane, trafficked there by lipid modification and association with membrane scaffolding, where they initiate signalling within seconds rather than the minutes-to-hours of the transcriptional route. A separate G protein-coupled receptor adds a third population. For an imaging problem this is awkward in a specific way: the membrane and nuclear forms are the same protein, so a ligand that distinguishes them cannot do it by recognising a different pocket.
Two numbers from that review set the difficulty. Membrane receptors are put at under 5% of the total receptor population . And across twenty studies of successful brain tracers for other targets, the available site concentration Bmax ran from 0.7 to 103 nM and the dissociation constant from 0.02 to 6.1 nM, with every one of those tracers holding a ratio between them above three . Set those side by side with a target expressed at low density across most of the brain, and the required affinity is not a matter of taste.
The review's candidate list is organised by what each compound could be labelled with. Four ERβ-preferring compounds are identified as directly labellable or labellable by halogen exchange; two ERα-selective pyrazoles would need a chelator and a metal; pathway-preferential estrogens are proposed for the membrane population; estrogen-dendrimer conjugates offer a size-based route to the same distinction, with the caveat that the conjugate changes shape with pH in a way that can hide the hormone entirely; and the two standard GPER tools are proposed as scaffolds, with existing technetium-99m complexes binding in the 10 to 30 nM range .
Computed calls for thirteen proposed compounds
Prediction from structure · not a measurement in any tissue
| Compound | Proposed for | Consensus LogP | TPSA (Ų) | Predicted to cross the barrier | Predicted efflux substrate |
|---|---|---|---|---|---|
| DPN | ERβ | 2.52 | 64.25 | Yes | No |
| ERB-041 | ERβ | 3.24 | 66.49 | Yes | No |
| WAY-200070 | ERβ | 2.93 | 66.49 | Yes | No |
| PaPE-2 | membrane receptors | 3.33 | 40.46 | Yes | No |
| LY-3201 | ERβ | 3.55 | 49.69 | Yes | Yes |
| AB-1 | ERα and ERβ, not GPER | 2.27 | 49.69 | Yes | Yes |
| PaPE-1 | membrane receptors | 3.37 | 40.46 | Yes | Yes |
| PaPE-3 | membrane receptors | 3.66 | 40.46 | Yes | Yes |
| G-1 | GPER, agonist | 4.06 | 47.56 | Yes | Yes |
| G-15 | GPER, antagonist | 4.08 | 30.49 | Yes | Yes |
| PPT | ERα | 4.25 | 78.51 | No | No |
| MPP | ERα, antagonist | 4.62 | 70.75 | No | Yes |
| Estetrol | nuclear, not membrane | 1.66 | 80.92 | No | Yes |
Four compounds survive both computed filters: DPN, ERB-041, WAY-200070 and one pathway-preferential estrogen. A newer non-steroidal scaffold not in that table, derived from a clinical degrader and labelled with fluorine-18, appears in Peng 2025; only an indexed abstract was read, so no structure, affinity or uptake value from it is carried into this chapter . It is worth pausing on the first of those. DPN is the same scaffold whose analogues were set aside at gate two for inadequate affinity — and here it passes a gate-three filter comfortably. That is not a contradiction. It is exactly the shape of the problem: the gates are independent, and a compound can be well-behaved at one and disqualified at another .
The review is careful about what its own table is, and that care should be carried forward rather than dropped in citation. The transporter in the second column is P-glycoprotein, and the authors write that experimental data are needed to corroborate whether these compounds are effluxed, and add a species warning: rodents show higher efflux transporter activity than pigs, primates and humans, so a disappointing rodent result may not transfer either . A predicted yes at gate three is a hypothesis about gate three. It is not evidence at gate three, and the distinction is the difference between a candidate list and a result.
One further warning in that review connects directly to the chemistry section above. A labelled analogue of ERB-041 has been made — Zhou 2023 — and it suffers moderate defluorination because its fluorine sits on an aliphatic carbon, with the freed label accumulating in bone . For most targets that is a tolerable nuisance. For a brain target it is close to disqualifying, because the bone in question is the skull, and it surrounds the tissue being measured. The easiest position to label is once again the least stable one.
A programme is a capability, and a scanner is a measurement condition
Two kinds of good news circulate in this area: that brain-specific ligand development is actively funded, and that new scanners are far more sensitive. Both are true, both are useful, and neither is a tracer.
The DEEPER project listing records a funded programme, running from July 2025 to June 2028, for the discovery and preclinical development of fluorine-18 ligands aimed specifically at brain estrogen receptors . It sits inside a larger funding programme whose wider portfolio of imaging and endocrine projects belongs to the next chapter. The DEEPER barrier work package makes one of its tasks concrete: brain endothelial cells on permeable supports, co-cultures with astrocytes and pericytes, and three-dimensional barrier assembloids, used to test whether candidate and radiolabelled compounds cross. That is the gate-three experiment, named and staffed.
What those documents establish is activity and intent on a stated timetable. They do not establish a candidate, a permeability result, a validated model, availability of anything, or anyone's willingness to work with anyone else . The honest summary is the useful one: the specific experiment this chapter keeps identifying as missing is being set up by someone, which is a reason to watch rather than a reason to wait.
The instrumentation argument needs the same discipline. Omidvari 2025 shows that a current brain-dedicated scanner holds quantitative accuracy at substantially reduced counts and can measure blood activity directly from the image. For a low-signal tracer that is genuinely enabling: shorter frames, smaller structures held apart, less reliance on arterial lines. It changes what is feasible.
CaveatIt changes nothing at gates two, three and four. A scanner that counts better still counts whatever the isotope is attached to. It cannot make a non-specific signal specific, it cannot raise a compound's affinity, and an image-derived blood curve is whole-blood activity — not the metabolite-corrected plasma input a kinetic model requires. In the source itself, the image-derived blood measurement is validated against longer-frame image measurements, which is an internal consistency check rather than a comparison with plasma .
Walk a compound through the gates yourself
The argument of this chapter is a bookkeeping argument, and bookkeeping is easier to believe when you can turn it over in your hands. Pick a compound and step it forward; the evidence at each gate is quoted as it was found, and the empty gates stay empty.
Four of the compounds below have a published stopping point; one is a lead read only at abstract level; one is a programme with no compound at all. The point of putting them in the same frame is not to rank them. It is that the frame has the same five columns for all of them, so the shape of what is missing becomes comparable even when the evidence is not.
The gate walker
Evidence as found · empty gates stay empty
Which candidate has the shortest remaining chain
The useful question is not which molecule is best. It is which one has the fewest missing measurements between its published position and a defensible brain signal — and that is answerable from the literature, before anyone synthesises anything.
The chapter's material supports a specific and cheap first move: a chemical translation dossier for one candidate. Fix the exact structure and stereochemistry from a primary source rather than a database synonym. Record the affinity with its assay system, its comparator and its species, and refuse to place it on a scale with affinities from anywhere else. Then ask, in order, what is known about intact parent in plasma, about the unbound fraction, about entry, about displaceable binding in tissue, and about whether anyone has ever measured the same thing twice .
HypothesisDone for four or five compounds, that exercise would produce something this literature does not currently have: a ranked list of missing experiments rather than of molecules. The ranking criterion is not promise but cost — how many measurements separate a compound from a defensible statement, and whether the next one can be done in a dish, in a rodent, or only in a person.
Three design constraints follow from the cases above, and they are unusually concrete for a chapter about things that did not work. First, the screening species has to be chosen for the property that will decide the outcome: a rodent with no sex hormone-binding globulin cannot rank compounds whose fate depends on it, and a rodent with higher efflux activity than a human will reject compounds a human might have tolerated . Second, selectivity and affinity have to be reported as two numbers, because a ratio alone cannot distinguish a better compound from a worse one. Third, any claim about exposure needs to name its denominator: total or parent, conjugated or not, bound or free, plasma or cerebrospinal fluid or tissue.
And one measurement would do more than any other. For a single candidate with adequate affinity, run a baseline and blocked pair in the same animal while measuring intact parent and unbound fraction at the same time . That design answers gates three and four together, which is the junction every compound in this chapter failed to cross or was never taken to. It is also the point at which the barrier work being set up elsewhere and the quantification machinery of the earlier chapters would meet — the chemistry and the measurement problem are the same problem, approached from two ends.
The next chapter turns from molecules to material: the datasets, registries and access states that would make such a question answerable without first building a tracer.
What this chapter does not show
- That any compound here is ready to test. No candidate in the inspected literature has documented evidence of a target-specific brain signal, and none has reached the quantification gate.
- That the diarylpropionitrile result is a brain imaging failure. It is an in vitro prioritisation decision on purified receptor protein, and no animal was scanned.
- That the fluorinated moxestrol series demonstrates a barrier problem. It demonstrates a species difference in plasma protein binding and metabolism, measured in hepatocytes, with the imaging failure documented in breast tumours.
- That the drug trials measured receptor occupancy. Their endpoints are a working-memory MRI contrast, a platelet enzyme activity and arterial stiffness; a null response does not identify which link in the chain failed.
- That computed permeation calls establish brain exposure. They are predictions from structure, labelled as such by their authors, and the efflux calls are explicitly awaiting experimental confirmation.
- That the funded development programmes have a tracer, a result, or any availability. They establish that the work is under way.
- That a more sensitive scanner addresses chemical specificity. It changes feasibility at the quantification gate only.
- That the candidate landscape here is complete. Several leads — the fluorine-18 ERα probe among them — rest on indexed abstracts whose original text, structures and supplements have not been read.
08
Resources and collaboration · deposits, registries, access states, the menu
What already exists, and four ways in
Seven chapters took one signal apart. This one asks what a collaboration could use tomorrow: public deposits, controlled cohorts and registered designs, each in a different state of readiness. Nothing here has been downloaded or analysed. Held honestly, those states turn the spectrum back into a menu.
ObservedTen data deposits and five registry records bear on this report's questions. Their public listings were read; no data file was downloaded and no value analysed.
AttributionReusable for methods is not reusable for the biological question. The open PET deposits are one COX-2 validation study without endocrine annotation; the endocrine PET cohort sits behind an agreement.
DiscriminatorThree checks decide each resource's use: a pinned version with its complete file list, the variables actually recorded, and the access terms in writing.
Next questionWhich of four entry points fits a collaborator's interests, methods and material? That conversation has not happened, and the menu is built not to presume its answer.
A description, a dataset and a value are different things
A resource can be described in public, listed file by file, downloaded, opened and analysed. Each step is a separate achievement, and in this review no resource got past the second.
Every source in this report carries a reading depth: full text, partial reading, registry record, lead. Data resources need the same discipline with one more distinction. A paper's data statement is a description. A repository listing that names files, sizes and a licence is an inventory. Files on a local disk are acquired; files opened and checked are read; numbers computed from them are analysed. Each state licenses a different sentence, and the commonest error in the resources section of a review is to write the last sentence on the strength of the first.
The ladder below holds every data deposit this review found that bears directly on its questions. Read it from the left. Most lines stop at the second rung. Two reach partway into the third, because three small descriptor files were saved from each, none of them containing participant data . The two right-hand rungs are empty for every line. That is a statement about this review, not about the resources: no image, blood curve, expression value or participant record has been read or analysed anywhere in the report.
Ten data deposits, each drawn to the furthest state this review reached
States as checked on 2 October 2026
Deposit
DeclaredDecl.
InventoriedInv.
AcquiredAcq.
ReadRead
AnalysedAnalysed
Access
ds004869Human COX-2 PET with arterial inputYan 2025 · 27 subjects · 278 files · 8.37 GBStops at: descriptor files only
descriptor files only
Open · CC0
ds005605Rodent COX-2 PET, blocking sessionsYan 2025 · 18 animals · 65 files · 376 MBStops at: descriptor files only
descriptor files only
Open · CC0
Optical reporterEstrogen-response fluorescence, cell levelCara 2026 · 169.8 MB · README with exclusionsStops at: 403 on download
403 on download
Open · CC0Photometry on request
Reporter monkeysFES PET, MRI, histology archivesLi 2024 · 8 archives · 2.52 GBStops at: listing only
listing only
Open · CC BY
Sulfotransferase dockingProcessed simulation outputsMiccoli 2026 · 1 project file · 2.34 MBStops at: listing only
listing only
Open · CC BY
GSE268557VCD mouse hippocampal arrays28 sample titles · 8 / 6 / 6 / 8Stops at: sample titles only
sample titles only
Open
PN000018GnRH-agonist serotonin-transporter PETFrokjaer 2015 · 63 listed · 39.54 GBStops at: agreement required
agreement required
Controlled · DUA
Cycle perfusionMRI and retinal angiography, three phasesWright 2026 · 6.7 GiB archiveStops at: landing page only
landing page only
Open · CC BY
GSE288245 + codeOvariectomy hypothalamus transcriptomesBloom 2026 · declared by the authorsStops at: opens failed
opens failed
Unverified
GSE245831 · PRJNA1030000Ovariectomy microglial genesSaha 2024 · declared by the authorsStops at: not opened
not opened
Unverified
No deposit reached these states in this review
reachedpartly: descriptor files, or a landing page without a file listnot reached
Drawn separately: retrievals that failed
HTTP 403Optical reporter depositTwo selected small files, the README and a 78 KB quantification archive, refused an automated download.
Challenge pageGSE268557A direct request returned a challenge page; the sample titles were read on the public web page instead.
Challenge · errorGSE288245 and its codeDirect opens of the declared expression deposit and code repository failed.
HTTP 403Cycle-perfusion paperA local copy failed; the article was read on the web. Its dataset identifier failed too, then resolved on 2 October.
A failed retrieval is an access result. It is not evidence that a file, or a finding, does not exist.
Three practical lessons come out of building that ladder, and they apply to any reuse plan. First, a text field is not an inventory. The animal COX-2 deposit's README repeats the human paper's abstract, so it reads as if it held 27 people; its own subject list holds twelve mice and six rats . Second, versions move. The human descriptor was first captured from a mutable branch, and a cached page showed an older version than the live record , so any analysis has to start from a pinned snapshot. Third, a listing is not a route: the reporter deposit's listing and README were readable on the web while two of its smallest files refused an automated download.
The open PET data belong to one tracer study
The two most complete open PET deposits are the data behind a single COX-2 validation paper. They are a resource for measurement methods, not extra cohorts for an estrogen question.
Yan 2025 asked whether the carbon-11 radioligand MC1 is sensitive enough to measure the low density of COX-2 in healthy human brain . Twenty-seven participants were scanned with concurrent arterial sampling: ten before and after celecoxib, a COX-2-selective inhibitor, and seventeen in a test–retest design. Celecoxib reduced neocortical binding by about a quarter, with little effect in subcortical regions and cerebellum, in line with regional COX-2 transcript levels. Test–retest reliability was moderate, an intraclass correlation of 0.65 with 20% absolute retest variability, and reference-tissue methods cut the variability . In humanized mice, MC1 bound human but not rodent COX-2.
The deposits are that study and nothing more. OpenNeuro ds004869 holds the human data: its snapshot 1.4.1 lists 27 subjects, sessions named baseline, blocked, test and retest, 278 files and 8.37 GB, under a CC0 dedication . OpenNeuro ds005605 holds the animal validation: snapshot 1.1.0 lists three wild-type and nine humanized COX-2 mice and six rats, three of them controls and three given an inflammatory challenge, in 65 PET files and 376 MB . Treating them as a 27-person cohort plus an 18-animal cohort for estrogen work would count one paper twice and ask it a question it never posed.
27
human participants in one study: 10 blockade, 17 test–retest
15
of them women, by the deposit's own description (5 and 10)
8.37 GB
human snapshot 1.4.1, 278 files, never downloaded here
0
reproductive-stage fields declared in either participant schema
What is missing is endocrine annotation. The human participant schema declares sex, age and weight; the animal schema declares sex and age . Sex is recorded, so a sex-stratified methods check is conceivable. Sex is not endocrine state, though: nothing declared records cycle phase, menopausal status, contraception or a hormone measurement. That is a statement about two schema files, not proof that the study holds no such information .
Reusable for methods
Arterial input, blockade and test–retest sit in one open deposit. A reference-region assumption can be tested against its gold standard, and the yardstick for noise comes in the same download.
Reusable for the biological question
That needs an endocrine contrast someone assigned or measured, a target the contrast plausibly moves, and annotations that record it. No open PET deposit found here has all three.
The species result matters as much as the annotation. A tracer that binds human but not rat COX-2 cannot carry a standard ovariectomised-rat experiment, however good its human validation, and a humanized mouse tests binding to the human enzyme, not how that enzyme is normally regulated. Chapter 5 takes up what COX-2 imaging can and cannot say about inflammatory state; here the point is narrower. An open dataset's value is set by the question its design can answer, not by its size or licence .
Hypothesis: a methods exercise these deposits could supportOn a pinned snapshot, compare estimates from the two-tissue compartment model with arterial input against reference-tissue estimates, region by region, and use the seventeen test–retest pairs as the yardstick for what counts as a real difference. The output would be a methods result about reference assumptions for a low-density target. It could not be an endocrine result.
Before any download, the checks are mundane and decisive: the full recursive file tree rather than two sample directories; whether every subject's blood files are present and readable; which sessions each subject actually has; the exact snapshot tag. The text fields need the same caution. The human descriptor cites a COX-1 tracer paper and a dopamine-transporter radiometabolite paper among its references, and the two deposits' READMEs carry different versions of the abstract: one says reference methods reduced between-subject variability by about 40%, the other by about half . Citations are not contents, and a README is not the paper of record.
A worked example, explicitly hypotheticalSuppose a future endocrine study with this tracer hoped to detect a 10% difference between two groups of women. The published absolute retest variability of the arterial measure is 20%: one person's value can move that much between two scans with nothing changed. A reference-tissue method that cuts the variability would shrink the sample needed, but only if its estimates stay unbiased in both groups, and an endocrine contrast is exactly the situation in which a reference region might drift. That conditional is what a methods exercise on the open deposits could test before anyone recruits.
Reporter, expression and docking deposits: orthogonal, unopened
The deposits that could link a ligand signal to receptor protein, transcription or cell type are small and openly licensed. Each comes with one specific boundary that decides what it can carry.
The optical reporter deposit accompanies Cara 2026, which built a neuronal reporter for estrogen-response dynamics . One fluorescent channel marks cells that were transduced and recombined; the other reports estrogen-responsive transcription. Neither is a calibrated measure of receptor abundance. The public listing gives 169.8 MB, with small quantification archives kept apart from the microscopy, and its README sets out exclusion rules. Some excluded animals remain in the deposited measurements, so any reuse has to reapply those rules rather than trust row counts . The listing displays a CC0 dedication; the photometry, the article states, is available on request rather than deposited. Thousands of cell rows are not thousands of animals.
The engineered-receptor monkey deposit belongs to Li 2024. It is a different resource, though both concern estrogen receptors and both reached this review through reporter work. Its public listing, rechecked on 2 October, shows eight archives totalling 2.52 GB under CC BY 4.0: MRI and PET for three animals and histology for two . No archive is named for blood or plasma data, so whether the arterial input of the native blocking phase is included cannot be known until one is opened . Chapter 1 explains why that phase, two animals with estradiol pre-treatment and full kinetics, is the best-controlled primate blocking study of native FES binding.
The sulfotransferase deposit from Miccoli 2026 is a single Origin project file of 2.34 MB under CC BY 4.0, holding the authors' processed docking and simulation outputs . It is tractable and open, and it contains predictions, not experimental binding constants. Reusing it cannot add an in-vivo contribution that the paper itself does not claim, and its proprietary format may need an export route before anything can be read.
GSE268557, a Gene Expression Omnibus series, deposits hippocampal arrays from 3xTg-AD mice after VCD-induced ovarian failure and from controls, at peri- and post-failure stages. Its 28 sample titles divide 8, 6, 6 and 8 across the four groups, not seven each . A 46.0 MB processed workbook and an 805.8 MB raw archive are listed and were not downloaded. Whether 28 arrays are 28 animals, and which publication they belong to, is unresolved; the record lists its citation as missing, which is not proof that none exists. Two further expression deposits are declared by their authors and unverified here: GSE288245, with analysis code, for the delayed-ovariectomy hypothalamus work of Bloom 2026, and GSE245831 with PRJNA1030000 for the microglial-gene study of Saha 2024 .
What to carry forwardThese four deposits measure four different things: an engineered transcriptional response, an engineered receptor target, a simulated binding pose and a transcript level. None of them is a receptor density, and each is useful precisely because it is not.
One declared deposit moved while this chapter was being written. Wright 2026 separated tissue perfusion from arrival time across the menstrual cycle, and its dataset identifier, which had failed to open earlier, resolved on 2 October to a public landing page: brain MRI and retinal angiography from 26 volunteers at three cycle phases, with oestrogen and progesterone samples, as a 6.7 GiB archive under CC BY 4.0 . The file tree was not inventoried, so the rung it reaches is a landing page, not a listing. The paper reports 21 MRI contributors among 26 recruits , exactly the kind of completeness question the archive would have to answer before anyone plans around it.
Controlled, conditional and withheld are three kinds of not open
Some of the most relevant human data are deliberately not public. The terms differ, and the differences decide what a first project can promise.
The GnRH-agonist trial of Frokjaer 2015 randomised 63 healthy women to a goserelin implant or placebo, with serotonin-transporter PET before and after; 60 completed . Its catalogue entry, PN000018, lists 63 participants, anatomical and PET data and 39.54 GB behind a Data User Agreement . It is controlled access to a known study, not a new cohort, and 63 listed participants are not 63 proven complete scan pairs. Its variables and visit completeness cannot be judged from the public metadata, and no access has been requested.
The Pill Project, NCT05212389, registers a randomised contraceptive-versus-placebo 5-HT4 PET design. Its data-sharing statement says the data will become available once the planned analyses are published, expected from December 2026, by application to the Cimbi database of molecular brain PET, and only with approval from the Danish data-protection authority and a signed agreement . That is a conditional future route, attached to a registry record last verified in February 2022.
Some data are not shareable at all. The participants in the human cetrozole series did not consent to public data sharing, as the methods paper states (Jonasson 2020) . A question about those scans would have to be asked of the investigators who hold them, as a methods collaboration rather than a request for a dataset. The reporter study's photometry sits in a fourth category: available on request.
CaveatNothing in this chapter has been requested, downloaded under an agreement, or discussed with any data holder or prospective collaborator. Access states are read from public records, can change, and need rechecking before they are written into a plan.
Registries are designs with dates attached
Five registry records add designs, endpoints and denominators. Status fields go stale, and a plan is not a result.
| Record | What it registers | Status as captured | What it is good for |
|---|---|---|---|
| FEMME NCT03681691 | Transdermal estradiol for eight weeks in postmenopausal women with or without type 2 diabetes; acetoacetate and FDG PET before and after | Completed; results posted. 12 enrolled, 9 completed, 8 in the primary PET outcomes | A dual-fuel measurement precedent with honest denominators. No untreated control |
| Pill Project NCT05212389 | Randomised combined pill versus placebo; 5-HT4 PET after three months | Status unknown; last verified February 2022; no results | A randomised design, and a conditional data route from December 2026 |
| MOSAIC NCT07021664 | 4FMFES with acetoacetate and FDG across the menopausal transition; estimated 45 women | Not yet recruiting; the estimated July 2025 start has passed | A lead for a receptor-plus-fuel design in the same women |
| WISH jRCTs031250654 | Menopause symptoms and AMPA PET with K-2; target 60 women aged 40 to 59 | Recruiting since February 2026; no results | Symptom, hormone and reference-region comparisons. Not a treatment trial |
| K-2 repeatability jRCTs031250631 | Two K-2 scans in 10 healthy men aged 20 to 39 | Recruiting; no numeric result | A precision-study precedent, not reliability in midlife women |
MOSAIC deserves one more sentence, because it echoes another record in the table. Sponsored by the Université de Sherbrooke, the group that developed 4FMFES, it pairs that receptor tracer with carbon-11 acetoacetate and FDG, the same two fuels FEMME measured . Checked again on 2 October 2026, it is a plan with a passed start date. If it runs, it would put a receptor tracer and a fuel-choice measurement in the same women; until then it is a registry lead, not recruitment and not results.
Registry records are easy to misuse in both directions. FEMME's original composite outcome shows zero participants because its results were split into four other measures, not because no PET was done . Conversely, an enrolment target is not an analysed sample. Each record is useful for exactly what it fixes in advance: the contrast, the timing, the endpoint and the denominator.
What remains thin
This review was broad, bounded and uneven. Some branches were read against originals; others rest on abstracts or were never searched with precision. The map shows where reading went, not how much literature exists.
Depth followed the questions. Direct receptor imaging, aromatase binding, the rodent and human endocrine designs, AMPA imaging, the chemistry failures and the perfusion designs were read against original papers, often with their supplements. The 73-row human study map is a different kind of material: 47 of its rows rest on abstracts alone . The neuroimmune branches beyond TSPO rest largely on abstracts and indexed methods. Several categories were left thin on purpose, so that effort could go into reading originals rather than paging through search results.
Where reading went
A map of effort, not a census
Read against originals
Direct receptor imagingFES, 4FMFES, engineered reporters01
Aromatase binding and challengecetrozole methods, nicotine, the peripheral negative02
Endocrine designsovariectomy, VCD depletion, the dual-fuel registry and protocol03
AMPA imagingregistries, metabolite model, reused validation cohort04
Perfusion designsrelative flow, total inflow, tissue perfusion and arrival06
Chemistry failuressubtype-selective series, fluorinated moxestrol07
Mixed: some originals, many abstracts
The human study map73 rows, 47 at abstract level04
Contraception and postpartum genealogyshared cohorts, a later abstract-only arm03
Neuroimmune targets beyond TSPOMAO-B, P2X7, CSF1R, COX at indexed depth05
Sulfotransferase chainrecent computational paper read; older experimental chain not02
Drug-first trialsregistries and abstracts; denominators unresolved07
Thin: scattered leads
Conference proceedings
Patent families
Non-English chemistryone fluorine-18 ERα probe known only from indexed abstracts
Regulatory-label comparisons
Membrane receptors and the GPER question
Postpartum and gender-affirming treatmentno precision searches
Non-US registries and industry programmes
Not systematically searched
CB2
P2Y12
Imidazoline binding sites
Two facts about the searching belong beside that map. One precise search, checked against papers already known to be relevant, missed three of them; a broadened version recovered all three . And the broad database searches were not paged to the end: of 1,578 records captured, most were never screened, and those records are occurrences, not studies. Neither fact undermines what was read. Both mean the report cannot say that a study does not exist, only that one was not found or not read.
Read the gaps as a work listA thin category is a place to look, not a negative finding. Proceedings may hold early menopause-imaging results; patents may hold structures that never reached a journal; non-English chemistry holds at least one estrogen-receptor probe this review knows only from an indexed abstract.
Four ways in
Four candidate starting points follow from the chapters and the resources. Each is a question with existing material, a missing requirement and a first deliverable. They are listed alphabetically, because ranking them would require knowing a collaborator's interests, methods and facilities.
None of the four needs a new scan to begin, and none presumes access to anyone's tracer, cohort or laboratory. They differ in the kind of first contribution they invite: an evidence synthesis that can be done at a desk, a reproducible analysis of data that are open or obtainable, or the design of an experiment that would come later. Each card names the chapters it draws on, so the spectrum the report took apart can be read back as material for a project.
Four entry points, in alphabetical order
Not ranked · no facilities assumed
Assay bridge
Synthesis first01020305
- Question
- When do ligand availability, receptor or enzyme protein and transcriptional response diverge across hormone withdrawal and replacement?
- Existing material
- The optical reporter deposit, the engineered-receptor monkey archives, the VCD hippocampal arrays, declared expression deposits.
- Missing requirement
- Working access to the files, with the authors' exclusions reapplied and animals, not cells, as the unit.
- First deliverable
- A one-target assay map: each source placed by what it measured, in which species, tissue and endocrine state, and which pairs would test agreement.
Chemical translation dossier
Synthesis010607
- Question
- For one candidate ligand, which measurements separate its published position from a defensible, target-specific brain signal?
- Existing material
- The failure register of Chapter 7, the human and rodent FES and 4FMFES evidence, current programme documents.
- Missing requirement
- Exact structures and supplements for the newer candidates; intact-parent and unbound exposure in brain; any cerebral blocking result.
- First deliverable
- A structure, assay and exposure dossier for one candidate, ending in its single decisive missing experiment.
Endocrine design synthesis
Synthesis01030406
- Question
- Which contrast, exposure, suppression, withdrawal, replacement or adaptation, does each existing study identify, and which reports reuse the same people?
- Existing material
- The rodent design comparison, the dual-fuel registry and protocol, the randomised contraceptive and GnRH-agonist designs, the 73-row human map.
- Missing requirement
- Original-source checks for unresolved table discrepancies and cohort links. No scanner or participant data are needed.
- First deliverable
- An endocrine-state and cohort table for a defined set of studies, ending in two or three contrasts worth testing.
Measurement-method study
Reproducible analysis01020506
- Question
- How far do reference-region and input assumptions move an outcome in an accessible tracer dataset, without claiming an endocrine effect the data cannot carry?
- Existing material
- The open human and animal COX-2 deposits, with arterial input, blockade and test–retest; the published FES denominator arithmetic.
- Missing requirement
- A pinned snapshot inspected file by file, with blood files and sessions confirmed; endocrine annotation is absent, so no endocrine estimand.
- First deliverable
- A pre-specified comparison of reference-tissue and arterial estimates, judged against test–retest noise and reported as a methods result.
An assay bridge starts from the distinction the first two chapters kept returning to: a ligand signal is not a protein amount, and neither is a transcriptional response. The reporter deposit, the engineered-receptor archives and the VCD arrays each measure a different one of those quantities, in different species and states. Laid side by side for one target, they would show where evidence pairs up and where it never has, and only then whether any deposit is worth opening .
A chemical translation dossier takes the opposite end. Chapter 7 showed that every documented failure stopped at an identifiable gate. The dossier walks one candidate through those gates on published material and ends not with a verdict on the molecule but with the single experiment that would move it furthest. Current programmes show that the capability is being built. Within the CARE programme, a departmental DEEPER project listing records fluorine-18 brain estrogen-receptor ligand development from July 2025 to June 2028 , and the DEEPER barrier work package specifies endothelial cultures, co-cultures with astrocytes and pericytes, and assembloids for permeability testing. Programme documents establish activity; they do not supply a candidate.
An endocrine design synthesis needs no data at all. Chapter 3 showed that natural cycles, abrupt surgical loss, gradual depletion, suppression and replacement are different experiments, and Chapter 4's map showed how few designs isolate estradiol. A table of what each study manipulated, when, and in whom, including which reports reuse the same participants, would turn that argument into an instrument others could use, and its output would be the two or three contrasts worth testing.
A measurement-method study is the one entry point with open data waiting at the other end. The human COX-2 deposit holds arterial input, blockade and test–retest in one place, which is rare. Used for what it is, it could put a number on how far a reference-region assumption moves a low-density target's outcome. The same question asked of existing FES or cetrozole scans would bear directly on the estrogen findings, but those data are held by their investigators and could only be approached as a partnership .
Build a first project
Choose an entry point to see which bands of the report and which resources it draws on, what state those resources are in, and what would have to happen before work could start.
The tool below is a reading aid, not a planner. It shows dependencies the chapters establish. It does not estimate cost, likelihood of success, or anyone's appetite for the work.
Pick a way in
Reading aid · not a ranking
Whichever door a collaboration opens, the first conversation is the same, and it is about people rather than data: which of these questions interests the people involved, which methods and material they bring, and whether the first contribution should be a synthesis, a reproducible analysis or the design of a later experiment. None of that is assumed here, and no data holder or prospective collaborator has been contacted in preparing this report. The menu exists so that conversation can start from evidence rather than from a single attractive image.
The spectrum, reassembled
The field is promising because it contains several informative measurements, not because any one of them already captures estrogen's action in the brain.
Seven chapters decomposed one hormone-sensitive signal into its candidate explanations: receptor binding and the denominator it is divided by; synthesis and inactivation as separate targets; the endocrine trajectory that defines a contrast; downstream windows with their own clocks; neuroimmune measures that ask different questions; delivery as both biology and measurement condition; and chemistry, where translation breaks at identifiable gates. None of those bands is the whole signal. Each is a real measurement with a defined meaning, and that plurality is the field's strength.
The opportunity lies at the interfaces between them: endocrine timing and fuel use; local synthesis and receptor response; inflammatory cell state and tracer biology; hormone-sensitive delivery and target availability. A collaboration that connects a well-defined endocrine contrast to a validated molecular measurement, and checks it against an orthogonal assay, would be doing something this literature has not yet done .
Null results, failed tracers and unfinished source chains belong in that picture. The pituitary-only displacement, the peripheral blocking failure without target confirmation, the fluorinated moxestrol that worked in rats and not in women, the refused download from a reporter deposit and the registry that never updated are not obstacles to the story. Placed honestly, they mark where the next question is cheapest to ask.
What this chapter does not show
- That any resource here has been downloaded, opened or analysed. Listings, landing pages and six descriptor files were read; no participant, image, blood or expression value was.
- That the open COX-2 PET deposits are additional cohorts, or that they can carry an endocrine question. They are one validation study's data, without reproductive-stage annotation.
- That a failed download or a missing schema field shows that a file or a variable does not exist.
- That controlled or conditional access has been sought or granted, or that any data holder or prospective collaborator has been contacted.
- That the four entry points are ranked, costed, or feasible for any particular group.
- That the literature has been searched exhaustively. Several categories are thin, and three target classes were not systematically searched.
After the chapters · Library
Where the bands recombine
The chapters took one signal apart. This last part puts the evidence back together for the reader who returns: every cited source with what it showed and what limits it, every defined term, every claim that still waits on more evidence, and a plain account of how the review was assembled.
The source spectrum is drawn here from the chapters' citations.
Evidence library
Every cited source, with what it showed and what limits it
Each card pairs a source's finding with its key limitation, says how deeply this review read it, notes any participants it shares with other studies, and links to the original and to the places the chapters cite it.
Using it. Filter by chapter, kind of source or reading depth, or search across authors, titles, tracers, designs and findings; the numbers on each filter show what it would leave, given the others. Cited in jumps to the first citation of that source in the chapter, with its reference card open, and a button brings you back here. Index turns the cards into a one-line list for scanning.
Reading depth full text and methods checked partial: abstract plus indexed methods or specific sections registry, protocol, programme or metadata only a lead, not yet inspected.
The library assembles itself in the browser from the chapters' citations. If it does not appear, every source remains available as a card on its citation in the chapters.
Glossary
Every term the chapters define, from A to Z
Plain-language definitions, many with the error a term most often invites, marked as a caution. Illustrated definitions open with their picture; the chapter numbers under a definition jump to its first use in that chapter.
The glossary assembles itself in the browser from the chapters' definitions. Underlined terms in the chapters carry the same definitions.
What remains open
What can be said now, and what must happen before a stronger claim
None of these gaps prevents the reading this review offers. Each one blocks a stronger statement, and the right-hand side says what would have to happen first.
The list follows the review's own rule for promoting a claim: it moves up only when its source has been read deeply enough and its cohort, units and assumptions have been reconciled. Topics sit with the chapter that carries them. Where a source has a card, its name opens it.
Human FES imaging
Can be said nowRetention differences across menopause stages, a pharmacological challenge and method comparisons (Mosconi 2024, Ghazanfari 2024, Nerattini 2025), read in full text, with their shared participants made explicit.
Before a stronger claimReturn to the originals before quoting any new number. Show that the cerebral signal is target-specific, and test the blood-input and reference-region assumptions, before reading retention as receptor density.
4FMFES and the MOSAIC study
Can be said nowCross-species pituitary contrast and blocking evidence (Paquette 2020), and a registered human study that plans 4FMFES as a secondary measure (NCT07021664), as a lead.
Before a stronger claimRodent and pituitary results do not establish human cerebral specificity. Recheck the live registry before stating current status or access; an old registry snapshot says nothing about actual recruitment or results.
Engineered reporters, GPER and SV2A
Can be said nowAn inventory of the engineered-receptor (ChRERα) reporter data (Li 2024), a direct-binding challenge to GPER as an estrogen receptor (Liu 2024), and an SV2A imaging programme known by its title (SLAM-DUNC 2026).
Before a stronger claimImaging an engineered receptor does not validate the native one, and the reporter data archive has not been obtained. The GPER controversy is not settled here. A programme title is not SV2A outcome evidence.
Aromatase kinetics and the nicotine challenge
Can be said nowDynamic-model and nicotine-challenge findings with [11C]cetrozole (Jonasson 2020, Dubol 2023), reported with their shared cohort and the statistical threshold the authors used.
Before a stronger claimRecover the arterial and reference-region supplement, and reconcile how the papers describe scan order and which participants each one used. In any case, binding is not a measured rate of estrogen production.
The endometriosis tracer failure
Can be said nowSpecific cetrozole binding was not established in a tested ex-vivo subset, aromatase was not stained in that tissue, and the separate clinical pilot used a different tracer (Zhang 2026).
Before a stronger claimObtain the cited supplements and confirm the target in tissue before attributing the failure to affinity, to absence of the enzyme or to delivery.
Sulfotransferase (SULT) inactivation
Can be said nowBrain expression profiles and docking simulations that place amyloid-imaging tracers in sulfotransferase pockets (Miccoli 2026), with a declared processed-data deposit.
Before a stronger claimThe experimental original (Cole 2010), its human extension and the missing supplements of the 2026 work are needed before inferring any contribution in living brain or any binding affinity.
Glucose imaging after ovariectomy or gradual depletion
Can be said nowDifferent designs (Khayum 2020, Ramli 2024), compared qualitatively where the sources support it.
Before a stronger claimResolve the discrepancies between table, caption and methods in the first, and the tension between prose and figure over the late effect in the second, before any numeric pooling or a common trajectory across the transition.
The FEMME dual-tracer study
Can be said nowRegistry results (NCT03681691): 12 enrolled, nine completed and eight with the primary PET outcome; both groups received estradiol.
Before a stronger claimRead the rest of the protocol and the final implementation or publication. Paired covariance is not available, so no controlled causal or compensatory-fuel effect can be inferred.
Contraception, suppression and postpartum states
Can be said nowControlled designs, earlier-pass findings and known reuse of the same participants across papers.
Before a stronger claimThe randomized contraception trial's status is stale (NCT05212389); the path from contraception preprint to archive and the later postpartum window are unresolved; access to the controlled GnRH-agonist dataset (PN000018) has not been granted.
AMPA receptor imaging with [11C]K-2
Can be said nowThe design of the WISH study (jRCTs031250654), the precedent for modelling a labelled metabolite (Arisawa 2021), and the mechanism limits the sources support.
Before a stronger claimThe body and supplement of the original 2020 K-2 paper (Miyazaki 2020) and the K-40 work are pending; the WISH statistical analysis plan and the quantitative repeatability results (jRCTs031250631) are missing. No claim of treatment efficacy in menopause follows.
The inhibitory (GABA) perspective
Can be said nowAn estradiol-treated primate flumazenil experiment (Michopoulos 2013) and a human multimodal protocol, SAGE (Jimenez-Balado 2026), each at its stated reading depth.
Before a stronger claimFull methods before detailed quantification. Neither isolates a causal estrogen effect, and benzodiazepine-site binding is not GABA+ concentration or neurosteroid action. SAGE has no outcomes yet.
TSPO and the other neuroimmune targets
Can be said nowSeveral complementary biological questions, validation precedents and null results, across TSPO, MAO-B, P2X7, CSF1R and COX.
Before a stronger claimFull-method endocrine originals, and the unresolved CSF1R specificity paper, before recommending any tracer. Labels such as "cell-exclusive" or "activation" are not earned yet.
Flow, inflow and perfusion studies
Can be said nowA comparison of relative-flow, total-inflow and arterial spin labelling designs, keeping observed contrasts apart from causal ones.
Before a stronger claimThe units and figures of Sorensen 2001 are unresolved, the figures of Wright 2026 have not been checked visually from a local copy, and the original of Berman 1997 has not been read. No pooled vascular effect and no clinical benefit can be claimed.
Ligand chemistry
Can be said nowThe distinction between assays behind DPN's receptor-subtype preference (Moon 2009) and the limits on translating fluoromoxestrol (Jonson 1999).
Before a stronger claimExact structures, originals, supplements and versions of the GDC and PVBO compounds are pending. Affinities measured in unlike assays should not be ranked against each other.
The drug-first branch
Can be said nowFunctional outcomes, species differences in pharmacokinetics, and trial status for LY500307 (NCT01874756) and S-equol (Jackson 2011, Wilkins 2017, Sekikawa 2025).
Before a stronger claimThe LY500307 denominators are unresolved; S-equol parent and unbound brain exposure is not established; the ACE trial design is not an efficacy result; an acquired supplement is still unread.
Programmes and scanners
Can be said nowVerified programme tasks (the DEEPER project listing; the CARE programme) and instrumentation leads at abstract or indexed depth (Omidvari 2025).
Before a stronger claimCompleted candidate outputs, full methods and a tracer-specific test of what can be identified, before any promise of feasibility or access.
Resources: described is not the same as in hand
A dataset that is publicly described has not yet been obtained, and an obtained dataset has not yet been analysed. This is where each resource named in the review stands. Chapter 8 discusses what each could contribute.
OpenNeuro COX-2 datasets ds004869 · ds005605
Six small descriptor, schema and README files obtained and checked; no participant data. The descriptions are internally inconsistent (the animal README repeats the human abstract), and they were captured from a changing main branch, not a fixed version.
Pin a version; inspect the full file tree, size, actual subjects and sessions, input functions, genotype and annotations before planning any download. A missing endocrine field in one schema does not mean none exists.
neuro-seeER reporter deposit dryad.xksn02vw4Download refused
The public listing and its exclusion rules were inspected; selected small downloads returned HTTP 403. No values were analysed.
Resolve the exclusions and the actual files before any reuse.
ChRERα reporter archive Figshare 24764157
Metadata for eight files totalling 2,515,531,078 bytes under a reported CC BY 4.0 licence. No archive was downloaded, so its contents and the completeness of its arterial data are unverified. It is a different resource from neuro-seeER.
Recheck the live version, size and licence, and which files are needed, before reuse.
SULT processed project Zenodo 22304099
A processed analysis project, inventoried but not reanalysed. It supplies computational outputs, not experimental binding constants.
Treat it as a record of the computation, not as affinity evidence.
Experimental-menopause mouse series GSE268557
Sample titles suggest quality-control groups of 8, 6, 6 and 8.
Check the expression values, sample independence and the link to a publication; do not assume seven per group.
Declared model datasets GSE288245 · GSE245831 · PRJNA1030000Author-declared
Repositories declared in Bloom 2026 and Saha 2024.
Leads, not validated ready-to-run datasets: verify contents before planning on them.
Cycle perfusion data g-node.ginh76Author-declared
A data DOI declared by the authors of Wright 2026; the code is available on request.
The live inventory has not been verified.
GnRH-agonist manipulation cohort PN000018Controlled access
Available under a data use agreement; declared at 39.54 GB and 63 participants.
Not open access, and not 63 complete paired PET datasets. No access request has been made.
Searched thinly, or not yet systematically
The review's scope map stays visible. These areas were searched less deeply than the main branches, so the absence of a finding here says little.
- Conference proceedings
- Patent families
- Non-English chemistry
- Current regulatory-label comparisons
- Membrane receptor and GPER controversies
- Postpartum precision searches
- Gender-affirming hormone precision searches
- CB2, P2Y12 and imidazoline targets (not systematically searched)
Of fifteen structured literature-database queries, the eight broadest were not paged to the end. The seven narrower ones captured every result they returned, which still does not establish how sensitive the searches were, and most database hits were never screened.
A gap is a fact about the searchA failed search, an unanswered request or a refused download says nothing about whether a study exists. None of the gaps above is negative biological evidence, and nothing here should be read as "no study exists".
How this review was assembled
A bounded exploration, independently checked, and not a systematic review
The review set out to map a field broadly, with its competing explanations and its dead ends, rather than to estimate one effect. That choice decides what its numbers mean.
Discovery ran as bounded searches across literature databases, trial registries, preprint servers, theses, company and funder programmes, and data repositories. It was organised by seven scientific axes and fourteen deliberate probes, each aimed at a place a conventional database search tends to miss. The probes were not assumed to be equally productive, and the ones that found little are recorded as thin, not as empty.
Everything the searches returned went into a discovery register: 1,578 occurrences carrying 1,180 distinct identifiers (DOIs, PubMed IDs or URLs). These are search hits. Most were never screened, and neither number counts studies read, eligible studies or independent cohorts. Overlap between queries was kept on purpose.
From that register, and from an earlier and narrower review pass in September 2026 that centred on FES, a curated evidence base was assembled: 84 curated source occurrences, each inspected at a stated reading depth; 73 study-level rows of a human imaging map; and 65 core and claim records carried forward from the earlier pass. These are overlapping records, not additive studies. One publication can appear in all three.
Independent reviewers then examined that evidence base in four rounds, running their own searches and spot-checking primary sources, file hashes and links. The first two rounds found material gaps, among them missing perspectives on GABA imaging, 4FMFES, engineered receptor reporters and the GPER binding challenge, which were repaired before the next round. The third and fourth rounds were clean for the bounded question they were asked: is this evidence base ready to support a findings-led report? That is a readiness check. It is not a literature census, and it does not certify every source or this page.
The chapters were then written from that base, returning to original papers where a chapter needed more than the curated record held, and each load-bearing claim carries the reading depth of its source. No participant-level data were reanalysed: no images, blood curves or expression values. Evidence cutoff: 2 October 2026. Registry statuses and preprints may have moved since.
1Material gaps foundGABA imaging perspective added; repaired
2Material gaps foundEarlier claim records exposed; 4FMFES, MOSAIC, reporters and GPER added; repaired
3CleanFor bounded readiness of the evidence base
4CleanSecond consecutive clean round
This review is not
- a systematic review or a literature census
- a meta-analysis: no effect sizes are pooled
- a treatment recommendation or medical advice
- an experiment-ready protocol
What the counts count
1,578occurrences in the discovery registerSearch hits. Most were never screened or read.
1,180distinct identifiers among them (DOI, PubMed ID or URL)Not deduplicated publications, and not cohorts.
84curated source occurrences, each inspected at a stated depthSeveral can describe the same source.
73study-level rows of the human imaging map, assembled in an earlier pass of this projectRows, not independent cohorts.
65earlier-pass core and claim recordsThey overlap the rows and occurrences above.
·sources cited in the chapters of this edition (the library above)Citation keys; a few publications appear under two.
4independent review rounds of the evidence baseThe last two clean for readiness; not a census.
Seven axes
- Targets and chemistry. ERα, ERβ, membrane receptors and GPER; FES, 4FMFES and nonsteroidal candidates; local synthesis and inactivation.
- Measurement and validation. Delivery of intact tracer, metabolism, efflux, plasma binding, density versus affinity, nonspecific binding, arterial and reference methods, blocking, repeatability and cohort reuse.
- Endocrine states and interventions. Cycle and estrous phase, natural and surgical menopause, suppression, hormone therapy, contraception, postpartum states and gender-affirming hormones.
- Mechanistic models and downstream imaging. Ovarian-depletion and ageing models, synapses, serotonin and dopamine, metabolism, neuroimmune and vascular pathways.
- Methods and orthogonal assays. Autoradiography, tissue and cell specificity, receptor reporters, optical probes, omics, radiochemistry, scanners and image processing.
- Ecosystem and translation. Protocols, cohorts, laboratories, programmes, patents, regulatory documents, reusable data and software.
- Negative, absent and contradictory evidence. Failed compounds, null challenges, disproven assumptions, discontinued work, unsupported citation chains and unsearched categories.
Fourteen deliberate probes, and what each turned up
P01Conference abstractsAbstract clusters traced, among them a PVBO abstract and an LY500307 trial abstract; no census of proceedings.
P02International registriesA randomized contraception design with a stale status, the FEMME protocol with selected sections read, and earlier registry records.
P03PatentsTwo Chinese disclosures on estrogen-receptor chemistry and production, inspected in part.
P04PreprintsA preprint antecedent of PVBO traced through indexed passages; versions not yet compared.
P05Company and funder programmesThe DEEPER project and its barrier-testing tasks verified; the CARE programme's modalities separated.
P06Non-English chemistryA Chinese primary article on GDC identified; its full text could not be reached.
P07Regulatory documentsA label version for the FES product Cerianna surfaced; a detailed comparison is pending.
P08Repurposable peripheral probesThe endometriosis cetrozole blocking failure inspected; its clinical pilot used a different tracer.
P09InstrumentationThe NeuroEXPLORER scanner and a quantitative follow-up, at abstract or indexed depth.
P10Citation graphsReuse of participants traced across papers, preprints and datasets, so repeated publications are not counted twice.
P11Negative and supplement evidenceMAO-B and CPPC nulls and time-dependent vascular effects kept; preview copies kept apart from full texts.
P12Theses and legacy inventoriesA 122-page doctoral thesis on aromatase obtained and read selectively (Immenschuh 2024).
P13Drug-first, missing-tracer spaceA compound, assay and exposure comparison; the LY500307 protocol and registry; S-equol abstracts; the ACE design.
P14Unsourced claimsClaim boundaries checked: cell state versus binding, vascular endpoints, inconsistent dataset descriptions.